Life of a Magma Metric
A metric in Magma deployments may originate at gateways (AGW, FeG, etc.), Orc8r, or other targets (Postgres, AWS, etc.). In this document, we focus on the life of a metric that originates at the AGW, travels through the Orc8r to Prometheus, and is eventually displayed on the NMS UI.

Phase 1: Collection and export
On the AGW, metrics are collected and exported from Python and C++ services.
Python services
Every Python service on the access gateway defines Prometheus counters, gauges, and histograms in a metrics.py file. The subscriberdb service, for example, defines the following Prometheus metrics in its metrics.py file, among others
# metrics.py

SUBSCRIBER_SYNC_SUCCESS_TOTAL = Counter(
    'subscriber_sync_success',
    'Total number of successful subscriber syncs with cloud',
)

SUBSCRIBER_SYNC_FAILURE_TOTAL = Counter(
    'subscriber_sync_failure',
    'Total number of failed subscriber syncs with cloud',
)
It is then up to the service to set the values of these metrics appropriately, i.e., take the actual measurements. Subscriberdb increments its SUBSCRIBER_SYNC_SUCCESS_TOTAL counter in its client.py file after fetching subscriber data from the cloud successfully.
# client.py

logging.info("Successfully fetched all subscriber pages from the cloud!", )
SUBSCRIBER_SYNC_SUCCESS_TOTAL.inc()
Each Python service on the AGW extends the MagmaService class which implements the Service303 interface. This interface has the GetMetrics method which uses the metrics_export module to get metrics from the Python Prometheus client and encode them for export over gRPC.
# metrics_export.py

def get_metrics(registry=REGISTRY, verbose=False):
    # ...
    for metric_family in registry.collect():
        if metric_family.type in ('counter', 'gauge'):
            family_proto = encode_counter_gauge(metric_family, timestamp_ms)
    # ...
While each service defines and sets its own metrics, it is up to the magmad service to collect metrics from all services and export them to the Orc8r. When the magmad service gets started, it reads metrics configuration from magmad.yml. Then, magmad schedules its MetricsCollector object to collect and upload metrics every metrics_config.sync_interval seconds. The MetricsCollector object loops over all Python services and for each, calls GetMetrics over gRPC to obtain metrics from the Python service. Then, it divides the gRPC structures into chunks of 1 MB or less, and uploads these chunks to the metricsd Orc8r service over gRPC through the Collect method in metricsd.
# metrics_collector.py

def sync(self, service_name):
    # ...
    chan = ServiceRegistry.get_rpc_channel(
        'metricsd',
        ServiceRegistry.CLOUD,
        grpc_options=self._grpc_options,
    )
    client = MetricsControllerStub(chan)
    # ...
    sample_chunks = self._chunk_samples(samples)
    for idx, chunk in enumerate(sample_chunks):
        # ...
        future = client.Collect.future(
            metrics_container,
            self.grpc_timeout,
        )
    # ...
C/C++ services
Each C/C++ service also exposes the GetMetrics method that the magmad service uses to fetch collected metrics over gRPC. The MetricsSingleton class provides helpers and wrappers around the Prometheus C++ client. MetricsHelpers.cpp further wraps MetricsSingleton methods to make it even more convenient for Magma services to set and upload Prometheus metrics.
Similar to Python services, magmad divides the metrics collected from C++ services into chunks of 1 MB or less, and uploads them over gRPC to metricsd in the Orc8r.
Phase 2: Orchestrator and Prometheus
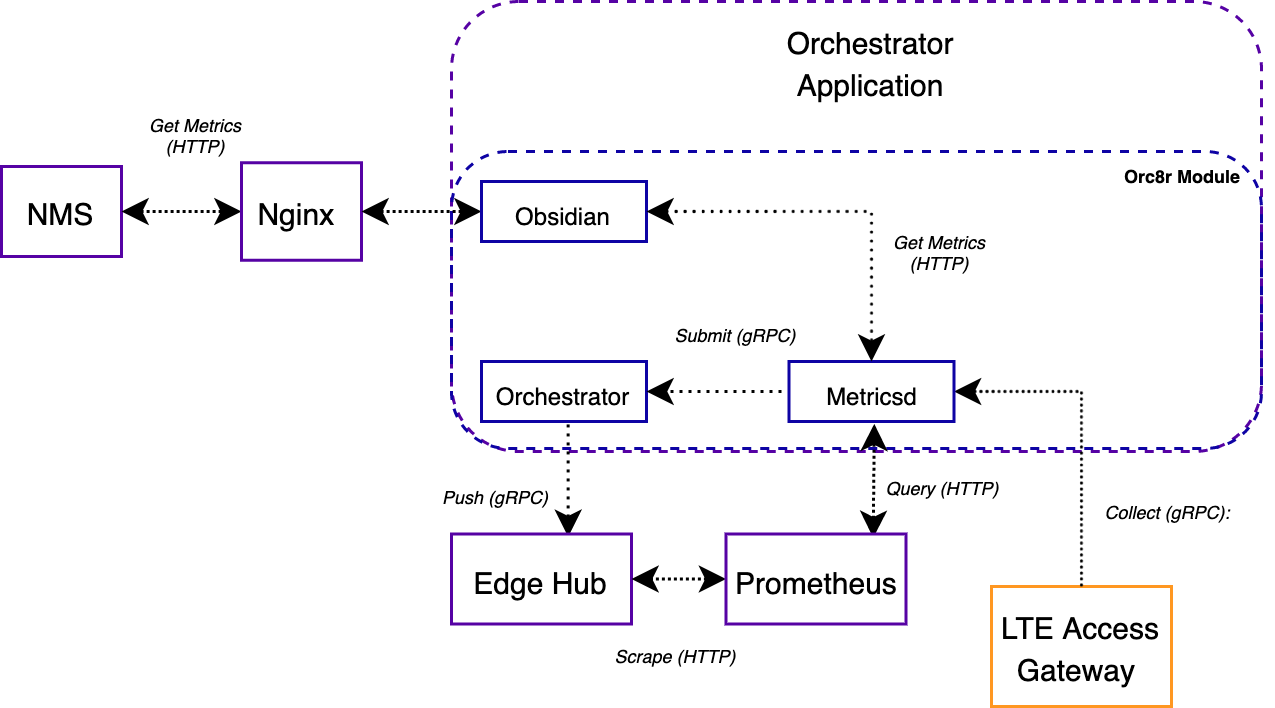
The metricsd cloud service reads metric names and labels from enums defined in metricsd.proto and accepts gRPC messages accordingly. Once it has received metrics from the AGW, metricsd pushes them again over gRPC to the MetricsExporter servicers in its Collect method.
// metricsd/servicers/servicer.go

func (srv *MetricsControllerServer) Push(ctx context.Context, in *protos.PushedMetricsContainer) (*protos.Void, error) {
    // ...
    metricsExporters, err := metricsd.GetMetricsExporters()
    // ...
    for _, e := range metricsExporters {
        err := e.Submit(metricsToSubmit)
        // ...
    }
This is one of the extensions supported in the Orc8r and the label orc8r.io/metrics_exporter can be used to export metrics to any data sink. By default, the GRPCPushExporterServicer, which is registered in the orchestrator service, is the only metrics exporter. So GRPCPushExporterServicer, through its Submit method, pushes metrics over gRPC to Prometheus Edge Hub.
// grpc_exporter_servicer.go

func (s *GRPCPushExporterServicer) pushFamilies(families []*io_prometheus_client.MetricFamily) error {
    // ...
    client, err := s.getClient()
    if err != nil {
        return err
    }
    _, err = client.Collect(context.Background(), &edge_hub.MetricFamilies{Families: families})
    // ...
}
Prometheus Edge Hub is a Facebook project that replaces the Prometheus Pushgateway. Orc8r's Prometheus service scrapes and drains the Edge Hub so metrics finally arrive at their home in the Prometheus server. On a dev environment, the Prometheus server runs at localhost:9090.
Phase 3: NMS and Grafana
The NMS initially reads metric names, descriptions and their corresponding PromQL from LteMetrics.json. Then, in Explorer.js, it filters relevant metrics for the network in question using the /networks/{network_id}/prometheus/series Orc8r endpoint.
// Explorer.js

export default function MetricsExplorer() {
    // ...
    // filter only those metrics which are relevant to this network
    const metricsMap = {};
    if (metricSeries != null) {
        metricSeries.forEach((labelSet: prometheus_labelset) => {
            metricsMap[labelSet['__name__']] = labelSet;
        });
    }
    // ...
}
This endpoint is part of the metricsd Orc8r service, and uses the QueryRestrictor interface to ensure that only metrics with the right labels (network, gateway etc.) are returned.
// query_restrictor.go

// RestrictQuery appends a label selector to each metric in a given query so
// that only metrics with those labels are returned from the query.
func (q *QueryRestrictor) RestrictQuery(query string) (string, error) {
    // ...
    promQuery, err := promql.ParseExpr(query)
    // ...
    promql.Inspect(promQuery, q.addRestrictorLabels())
    return promQuery.String(), nil
}
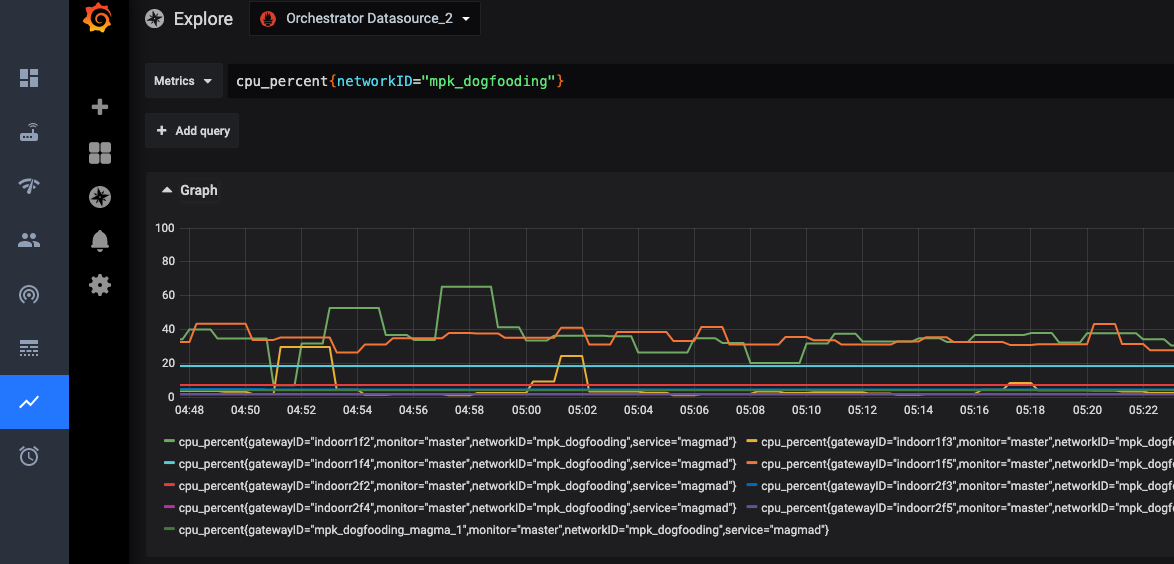
Magma provides dashboards to visualize and explore the collected metrics. In the NMS dashboard > Metrics > Explorer UI, each metric gets a Grafana <iframe> which connects to the Grafana Data Source API. In turn, the Grafana Data Source API proxies the parameterized metric request to Prometheus and displays the retrieved metrics.

