Proposal: VictoriaMetrics as Magma's TSDB
Author: @Scott8440
Last updated: 02/24/21
Abstract
Replace Prometheus with VictoriaMetrics as Magma's TSDB for ingesting, storing, and querying time-series data. This will enable increased scale and at the same time require less compute resources.
Background
Magma is getting to the point where scaling is a primary concern. One of the areas that could be most impacted by larger scale is metrics, since there is a direct correlation with the number of subscribers/gateways and the amount of data coming through the system. We’ve been relying on a single Prometheus server coupled to our prometheus-edge-hub which has worked for all of the small and medium deployments so far, but we’re getting pretty close to the limit where this setup would not be able to ingest more data. In addition to this, partners have been wanting to run magma at a lower cost, and compute resources is the most expensive part about running magma. The metrics pipeline can be a big resource hog so any improvements here can have direct improvements in the cost of running Magma.
Tests
These tests were performed on AWS using the same nodes as orc8r, but the metrics were sent directly to the metrics store rather than going through orc8r. This gives us a clear view on which data store is better in terms of performance and resource usage, and further investigations into improving services such as metricsd can take place later. Performance is measured in terms of datapoints/minute ingested, and Michael Germano is currently working on getting an estimate of how many datapoints/minute a subscriber or gateway produces so we can then determine what scale magma supports in terms of metrics. What follows is a fairly in-depth discussion of why each idea was implemented as well as the results of load testing and reasoning behind recommending or not recommending the solution.
Prometheus-Edge-Hub Improvements
Prometheus-edge-hub works by acting as a temporary store for prometheus datapoints which prometheus then scrapes. This is our current implementation and has been working for quite a while now, but it doesn’t appear to be able to scale up efficiently any further. I figured out some low hanging fruit was splitting up the scrape into several much smaller scrapes by splitting the metrics as they were ingested by the edge-hub. This allows prometheus to do many small scrapes which is how it typically operates and is what it’s optimized for.
Current implementation
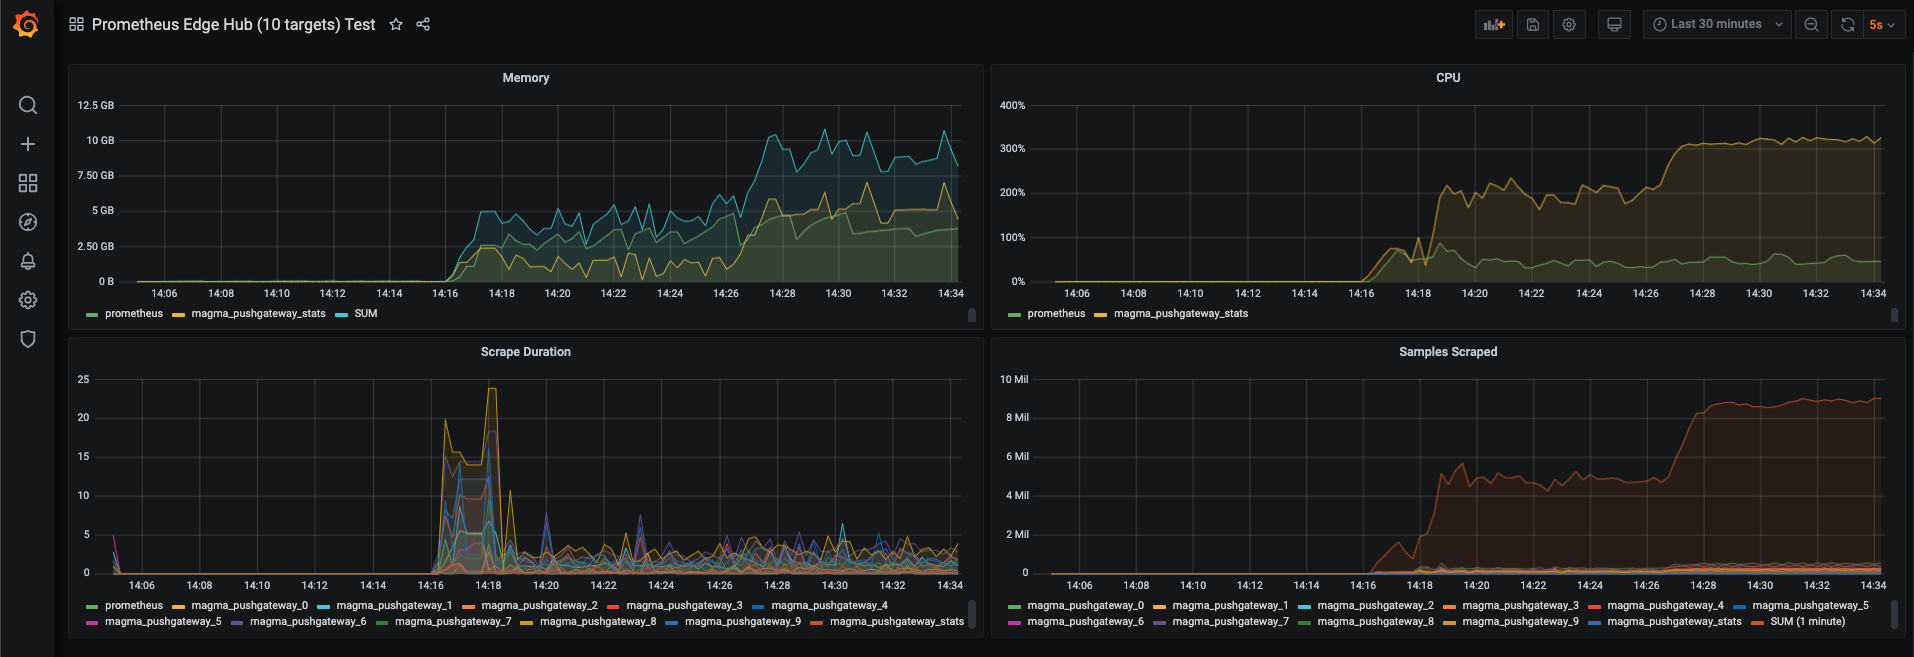
The main limitation is scrape times from prometheus. Scrapes would time out after 10s and then that data would be lost. It struggled to perform at 8M datapoints/Minute while using a combined 8GB of memory, with edge-hub consuming a full core of CPU.
We should use this number as our current limit with everything as-is. Adding worker nodes or getting a beefier one for prometheus or edge-hub would likely improve performance without any architecture change, but would just cost more.
With Improvements (Target Splitting)
~10M datapoints/minute with scrape times well within acceptable limits (~3s avg. with only 10 scrape targets).
Target splitting solved the problem of scrape timeouts almost perfectly, but seems to be using a lot more CPU (probably due to a bunch of hashing that’s required for the splitting). The logic could be improved a lot which would reduce CPU usage, but memory usage is probably not going to be an easy fix. Kubernetes kicked the edge-hub pod at the end of this scale test because of memory usage.

| Pros | Cons |
|---|---|
| No major change to architecture | Continue using edge-hub (increased resource consumption) |
| Have to continue developing/supporting this component |
Continued investment in this component would likely lead to decent scaling improvements, but we’d run into a hard limit of memory usage fairly quickly.
VictoriaMetrics
I read about VictoriaMetrics on the Prometheus mailing list in response to a
question about “prometheus can’t handle my metrics, how do I scale it out?”.
This is actually something we looked into way back when this all started but it
wasn’t open sourced back then. Now it is fully open source
with some insane
benchmarks
and significant https://docs.victoriametrics.com/CaseStudies.html community
usage.
The biggest benefit of VM is that it supports both push https://docs.victoriametrics.com/Single-server-VictoriaMetrics#how-to-import-data-in-prometheus-exposition-format
and pull https://docs.victoriametrics.com/Single-server-VictoriaMetrics#how-to-scrape-prometheus-exporters-such-as-node-exporter
natively.
This means we can completely get rid of prometheus-edge-hub and just push metrics directly from orc8r. Even if VM used exactly as much memory/cpu as prometheus we would still be better off due to getting rid of edge-hub, but as you can see from the load test it performs significantly better.
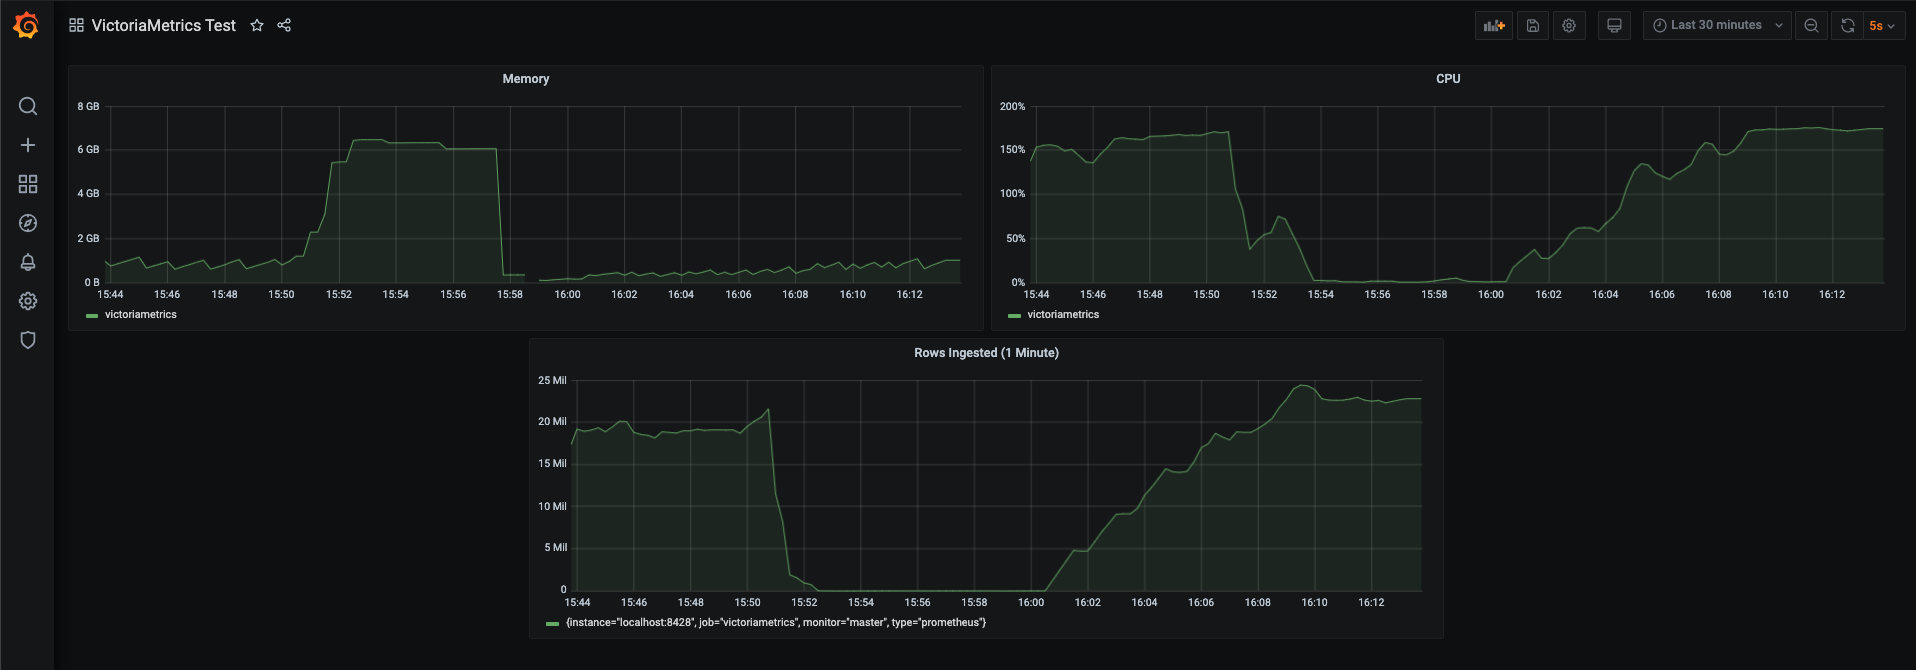
Ingested ~25M datapoints/minute while using on average 1GB of memory, and about ~1 full cpu core.
I had to do a tiny bit of tuning to some command line flags to get up to 25M and more tuning could be done to get it higher most likely given that it was only using <200% CPU.
Based on VM’s data this capacity should scale nearly linearly for quite a while with more/faster CPUs.
VM also offers a cluster https://docs.victoriametrics.com/Cluster-VictoriaMetrics
version which is very simply scaled horizontally behind a load balancer. Given
how well it scales vertically I don’t think this is something we’ll likely have
to look into for quite a while. Even then if we do I don’t think the
engineering work would be significant.
VictoriaMetrics integrates seamlessly with configmanager and the alerting setup is nearly identical to how Thanos does alerting, which I’ve already validated so there’s not much risk on that end.

| Pros | Cons |
|---|---|
| Simple drop-in replacement | No longer using prometheus, which is more supported/used in the community |
| Remove edge-hub | |
| Lower resource usage compared to prometheus |
Thanos Receive
Thanos provides a receive component which implements the Prometheus remote-write interface. This is intended to be used by federated prometheus servers writing to a thanos cluster in a very specific way. I hacked together an implementation of an orc8r metrics exporter that works with this, but I quickly ran into some weird issues that made me a lot more skeptical of this than I was at first. Long story short we would really be abusing this feature and even if I could figure out the first problems I found I’m fairly confident there would be more problems down the line. In fact this usage is explicitly called out as a non-goal in the design doc for Prometheus remote-write. I didn’t perform a scale test with this for those reasons.
| Pros | Cons |
|---|---|
| Remove edge-hub | Not the intended use-case, may run into weird bugs, won't have support |
| Simple change on orc8r | Already seeing errors just during simple testing |
| Thanos offers some benefits (e.g. remote object storage) that others don't provide | Thanos uses more resources than pure Prometheus or VictoriaMetrics |
Conclusion
VictoriaMetrics appears to be the clear winner. They claim to be able to replace a sizable cluster of competitor nodes with a single node of VM, and that was validated with these tests. If we wanted to ingest this much data with prometheus we’d have to run multiple servers or at the very least get a much more expensive one. I was pretty skeptical of the performance they touted on their website, but after doing the testing myself it seems to be legit. Given that I’ve already implemented VictoriaMetrics in orc8r for the purposes of testing, I expect very little additional engineering work to be required for this and it can almost certainly be ready for 1.5.
A note on SIs: Way back when we were deciding on TSDBs we were told that SIs really preferred Prometheus as the db since they have experience with it and know how to manage/scale/debug it/etc. That’s the main reason we chose Prometheus and invested into making it work. This has worked out so far, but also we’ve been doing all of the debugging/scaling work with it due to the orc8r-specific things we had to do to make it work (prometheus-edge-hub). I’m not sure if this argument holds water because of this, nor should it prevent us from making the switch to VictoriaMetrics since the alternative is going to require more engineering work for a likely worse product.
Implementation
The implementation for this is very straightforward.
- Deploy VictoriaMetrics in a single node configuration and then use the existing remote exporter to push metrics directly to VM.
- Configure metricsd to direct queries to the VM query endpoint rather than Prometheus
- Deploy victoriametrics-alert to handle alert evaluation
- Run prometheus-configmanager on the same node as victoriametrics-alert (with affinity rules).
Migrating data for existing deployments is also simple.
- https://medium.com/@romanhavronenko/victoriametrics-how-to-migrate-data-from-prometheus-d44a6728f043
- Write a simple script to take a snapshot of the prometheus data, and use an init-container to load this data into the new VM server before the upgrade.
