Alerts
Alerts are an important part of our NMS. We highly recommend the operators to run their networks with alerts always turned on. Without alerts, it is impossible to debug any potential issues happening on the network in a timely fashion. In this guide we will discuss
- Viewing Alerts
- Alert receiver configuration
- Alert rules configuration
- Predefined alerts
- Custom Alerts
- Troubleshooting
Viewing alerts
Top Level Network Dashboard
Alert dashboard displays the current firing alerts in a table tabbed by severity. In each of the columns we additionally display the labels passed along with the alert.
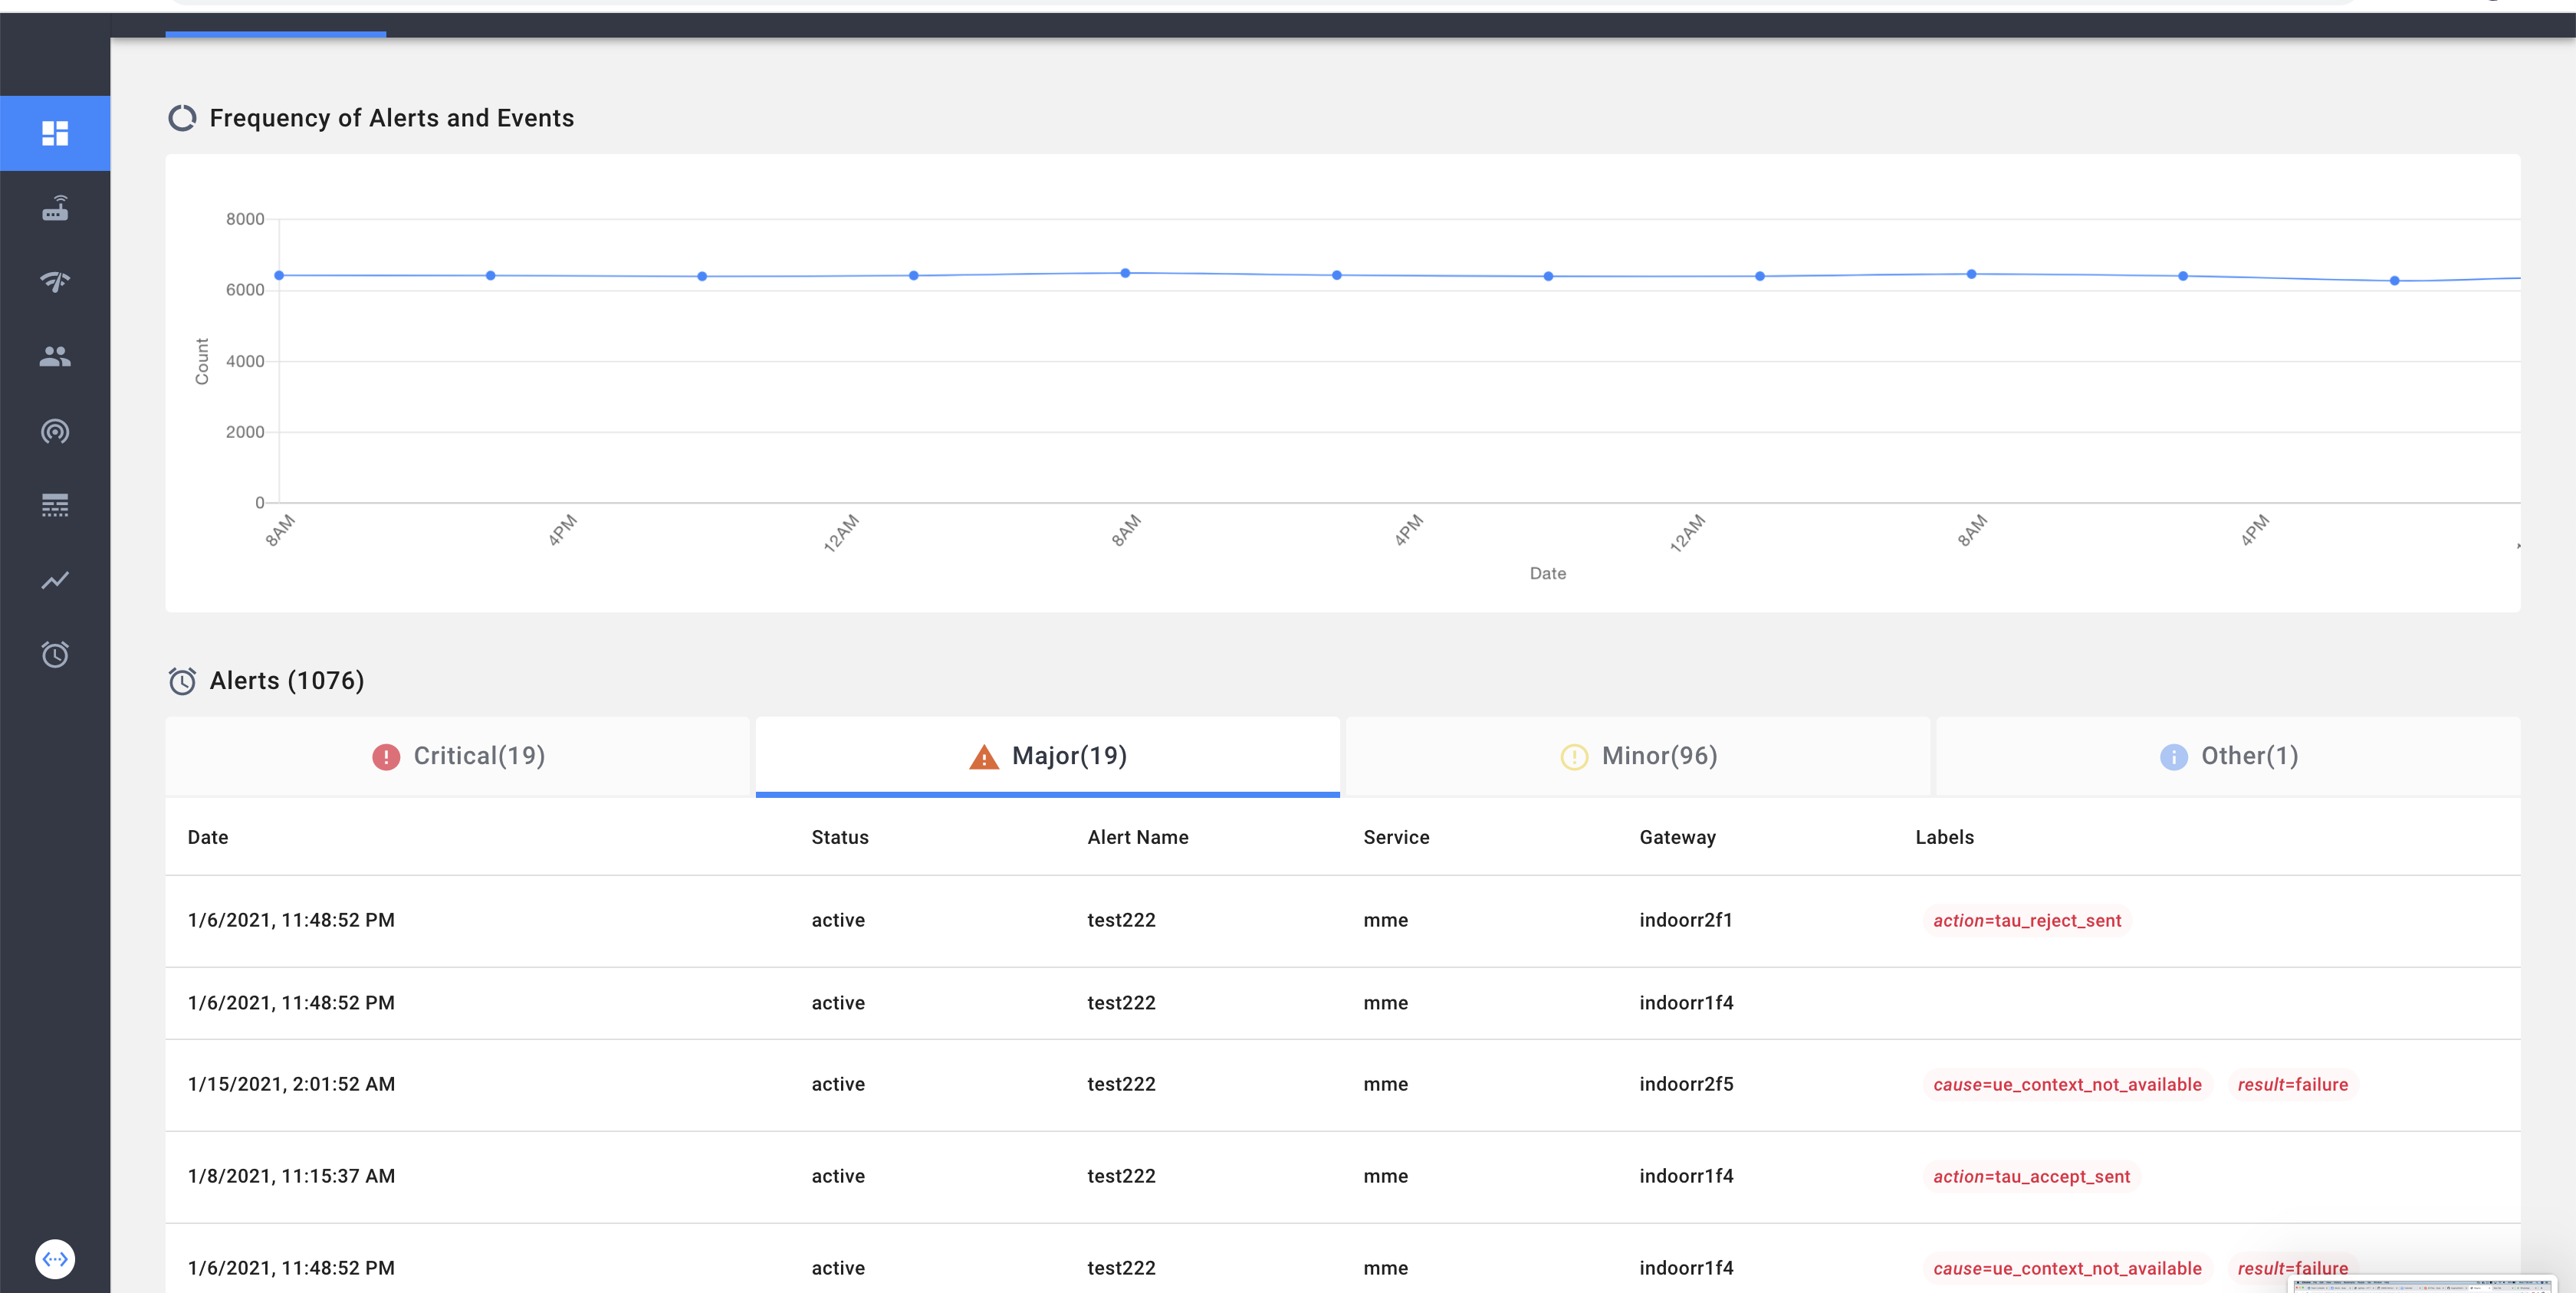
Alarm component’s Alert Tab
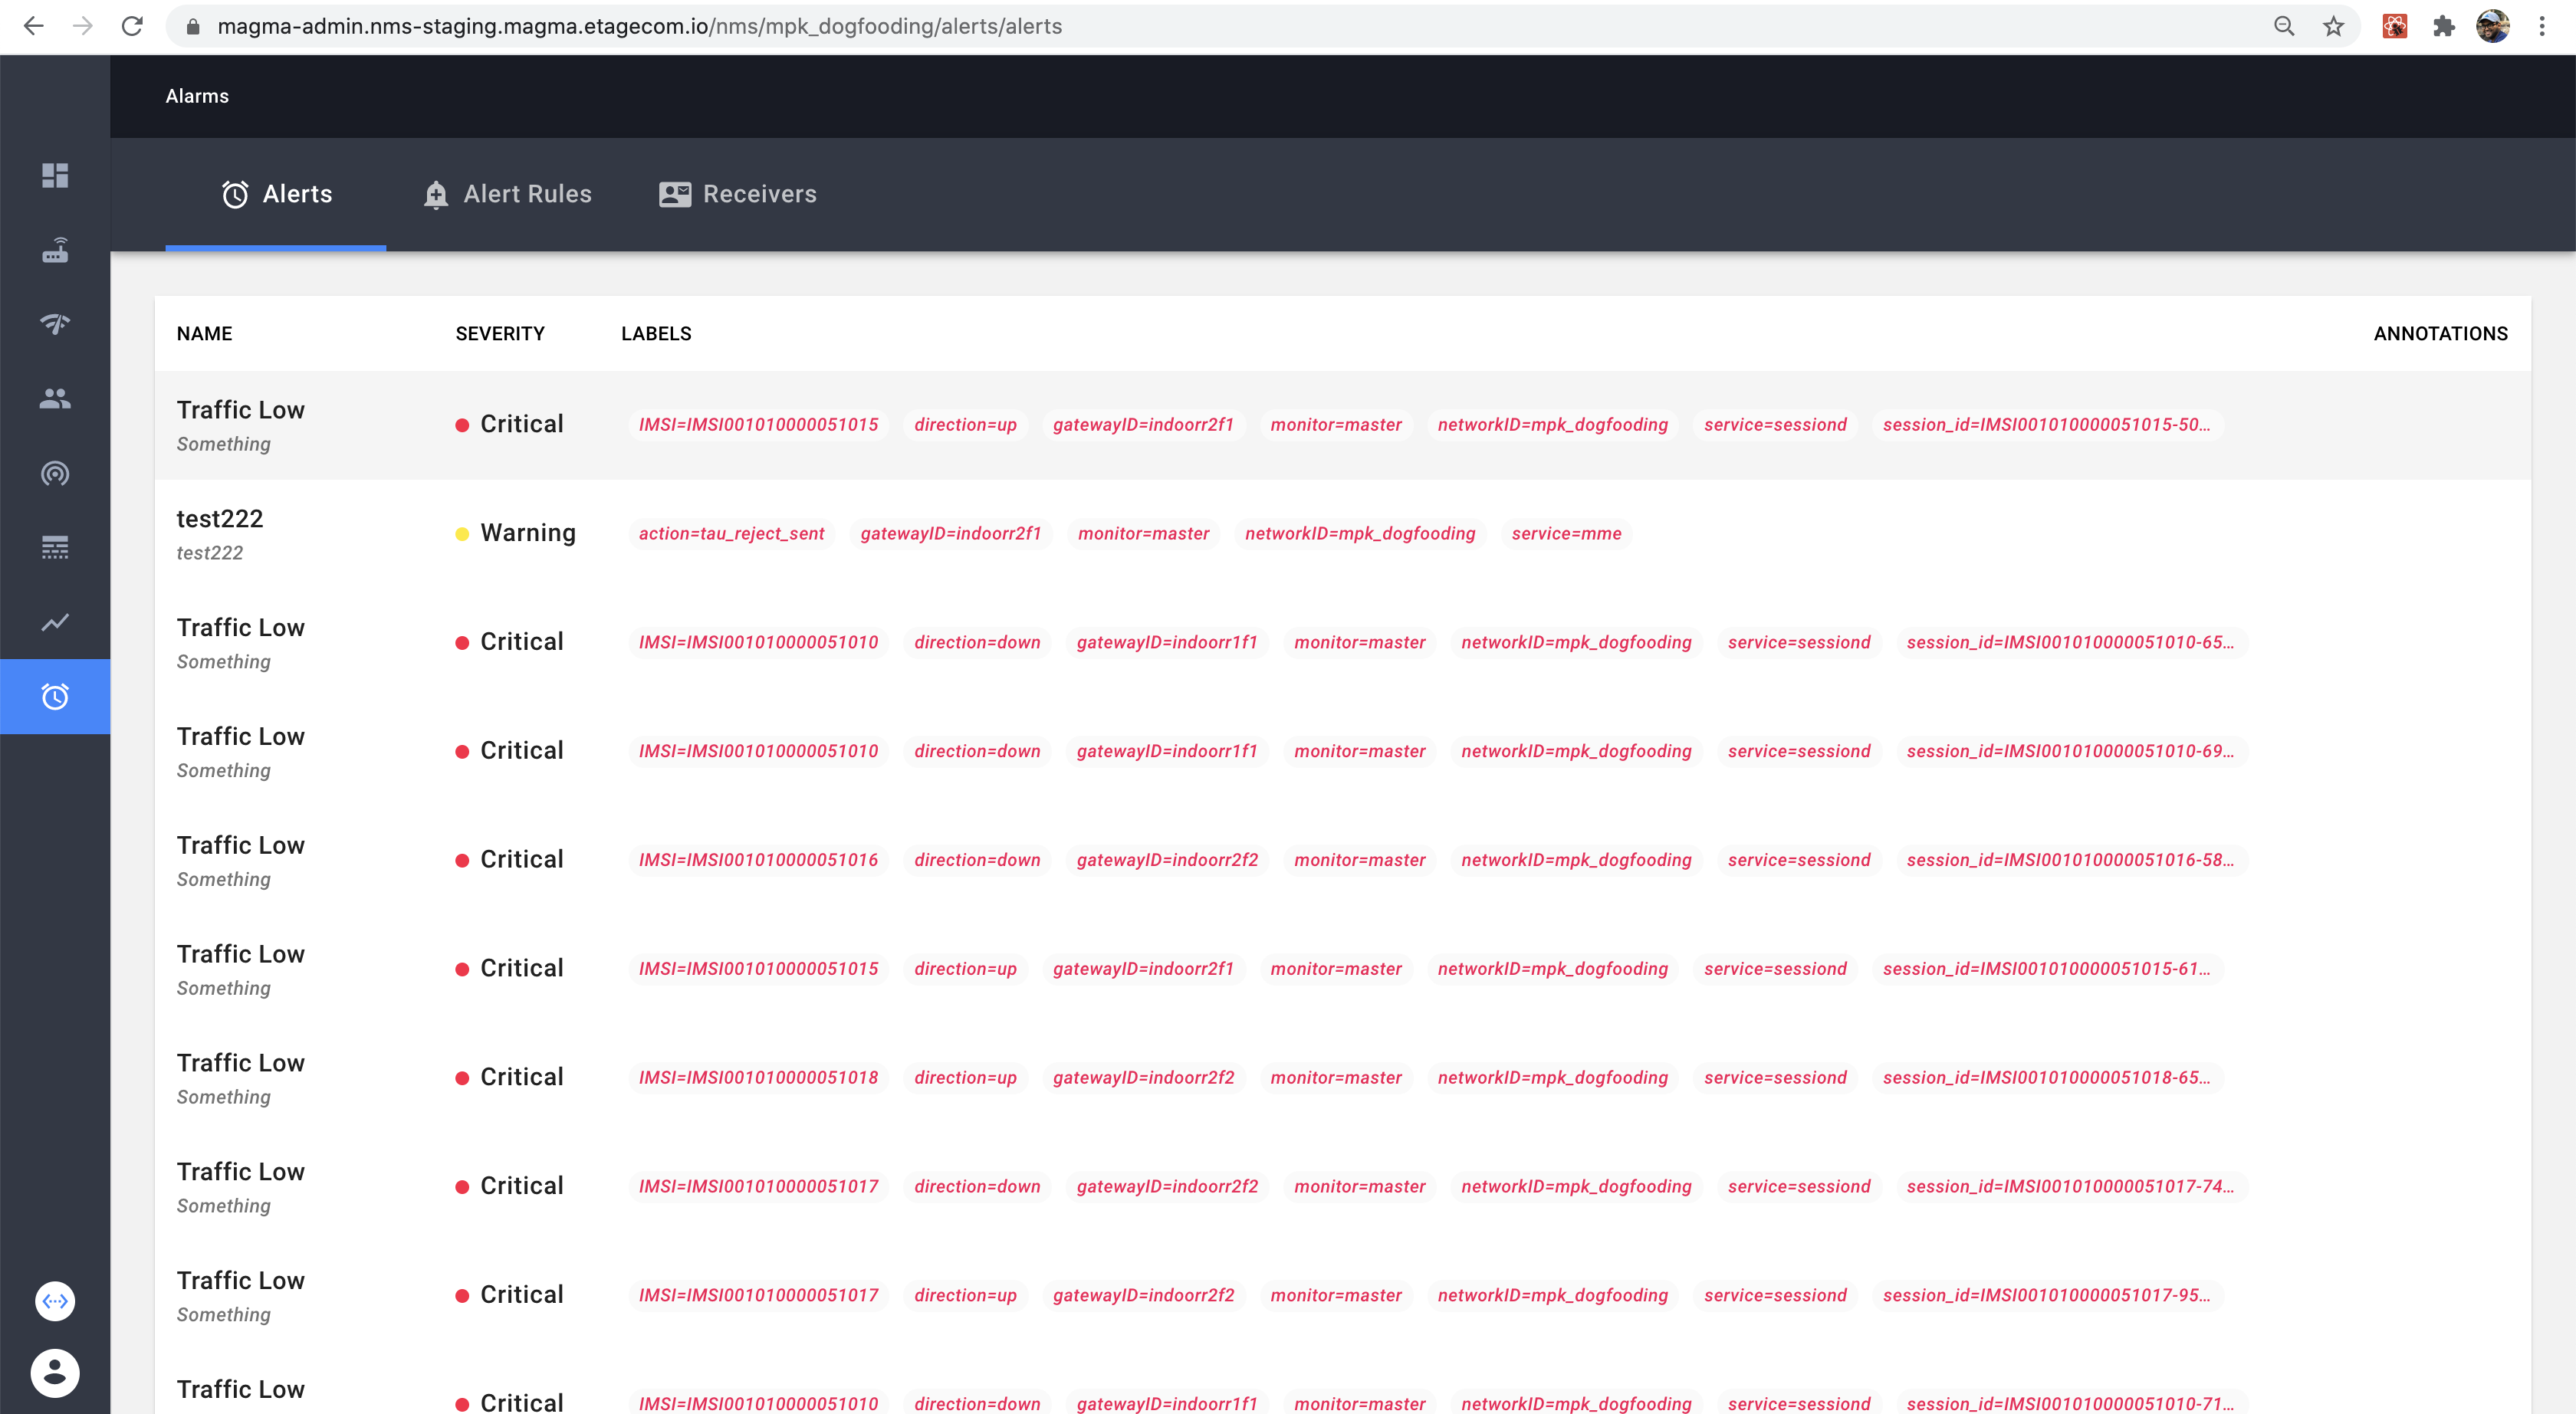
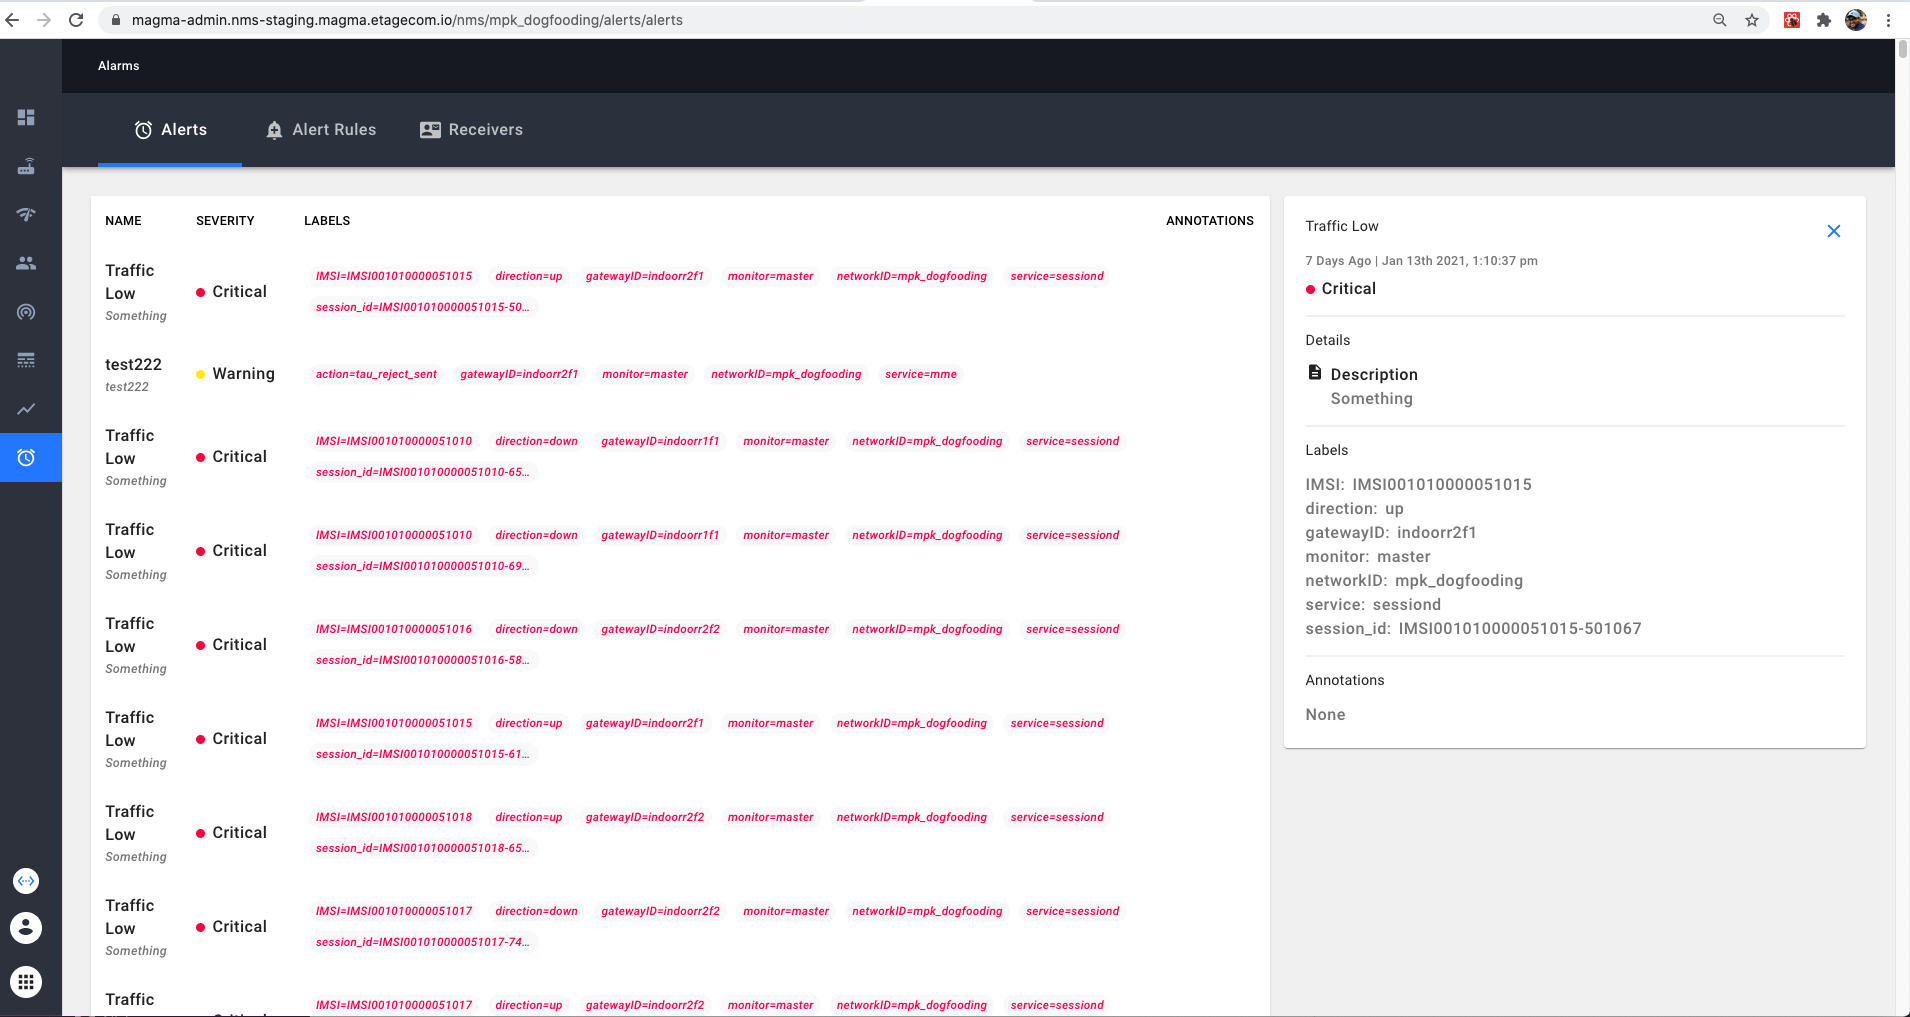
Alerts can also be viewed from the alert tab in the Alarm table.
Alert Receivers
An alert Receiver is created to push the alert notification in real time so that the operator is notified when the alert is fired. Following example details the steps involved in creating a slack alert receiver and configuring it in NMS.
Example: Adding Slack Channel as Alert Receiver
Generate Slack Webhook URL
Create an App: Go to https://api.slack.com/apps?new_app=1 and click on “Create New App”. Enter the App Name and the Slack Workspace.
Click on “Incoming Webhooks” and change “Active Incoming Webhooks” to On
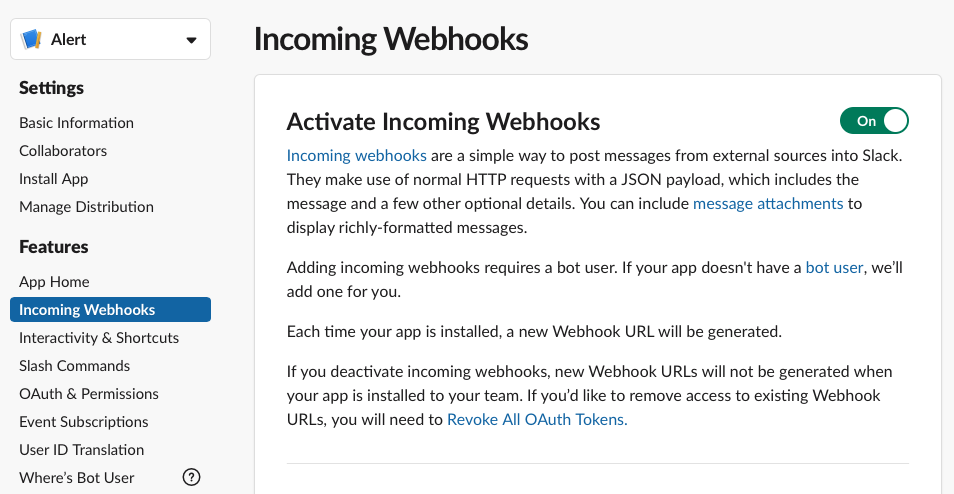
Scroll down and create a new Webhook by clicking on “Add New Webhook to Workspace”. Select the Slack Channel name.
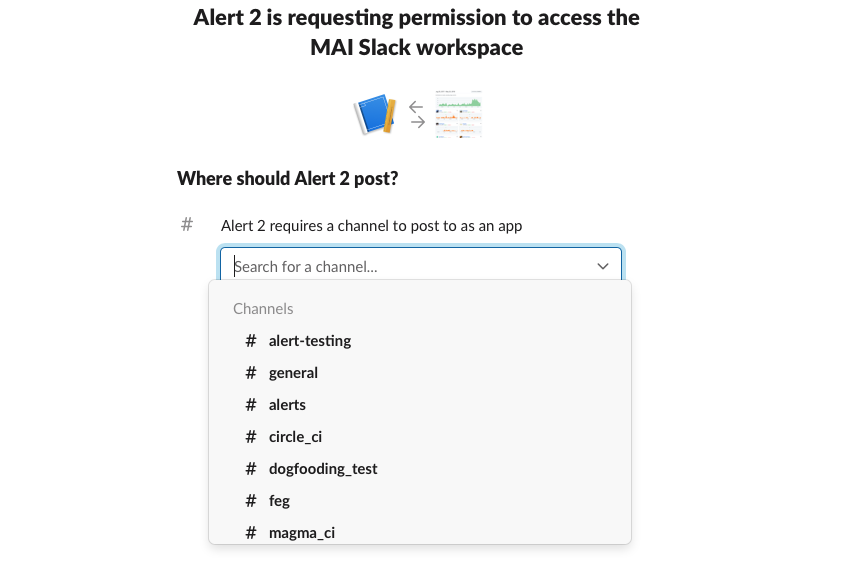
Copy the “Webhook URL” once it is generated.

Create a new Alert Receiver in NMS
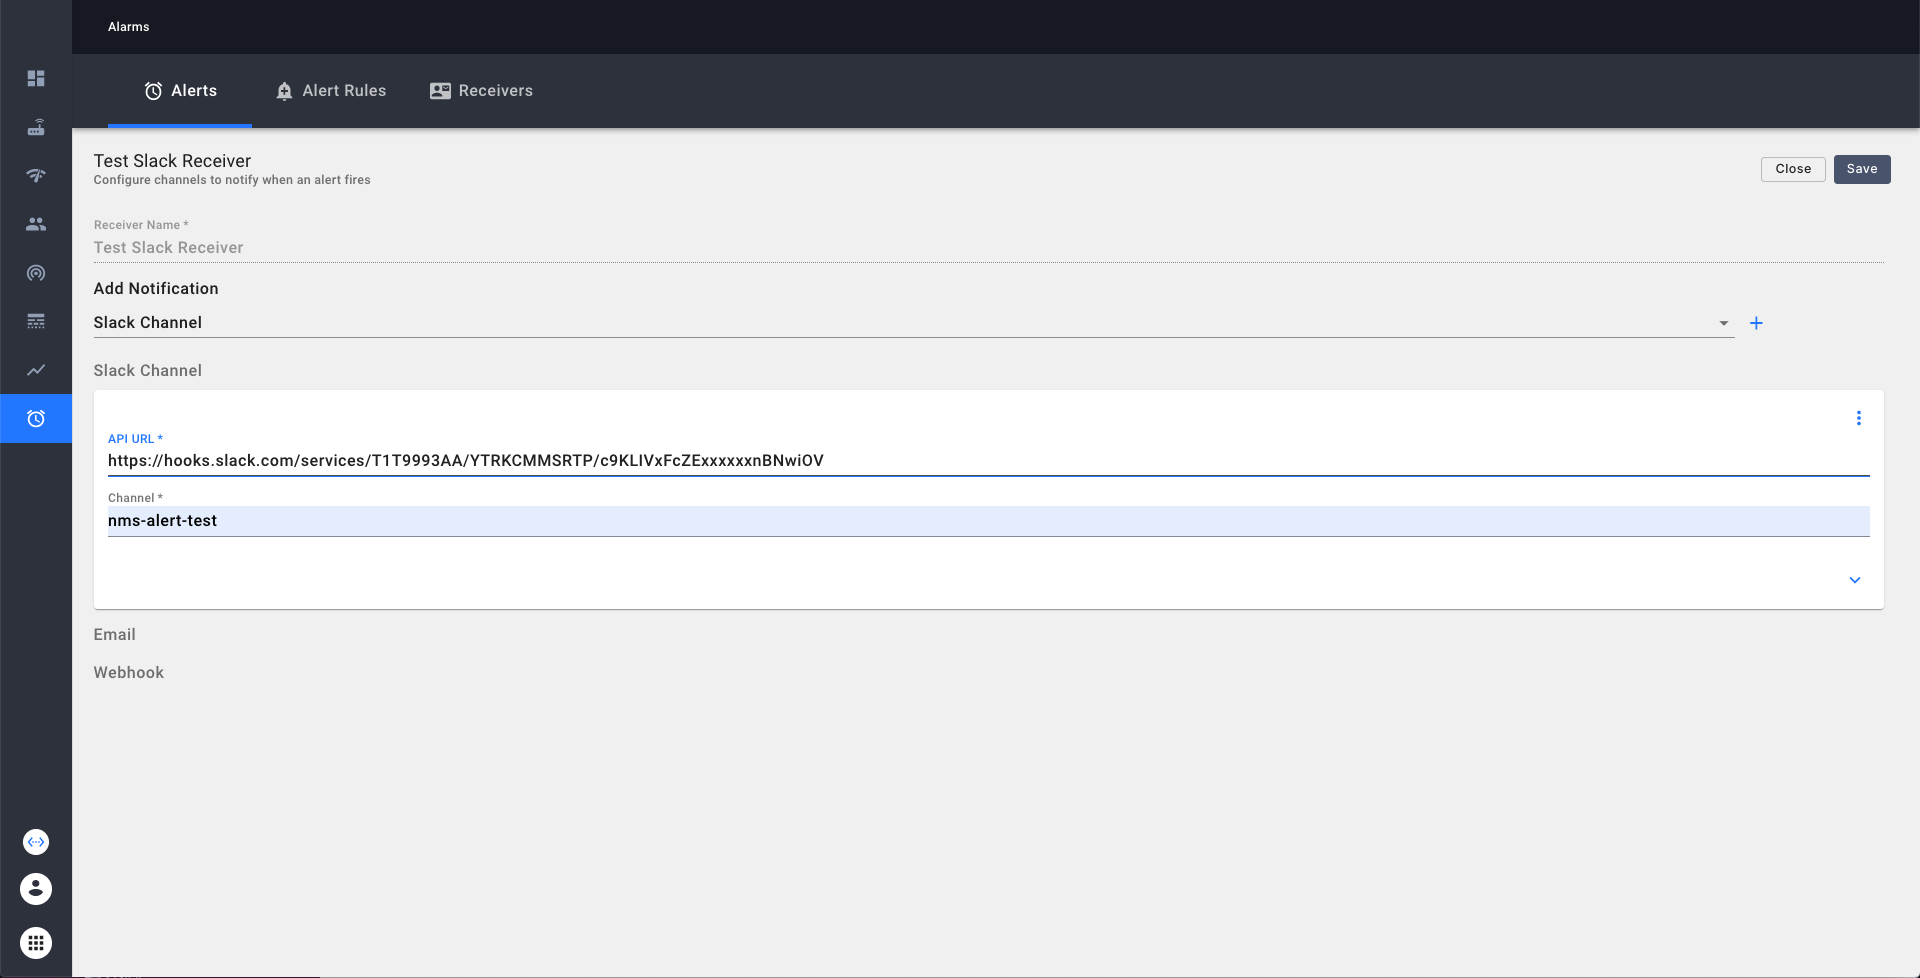
Testing the newly added alert receiver
Add a dummy alert to verify if the alert receiver is indeed working. A dummy alert expression can be constructed
with a PromQL advanced expresssion of vector(1) as shown below.
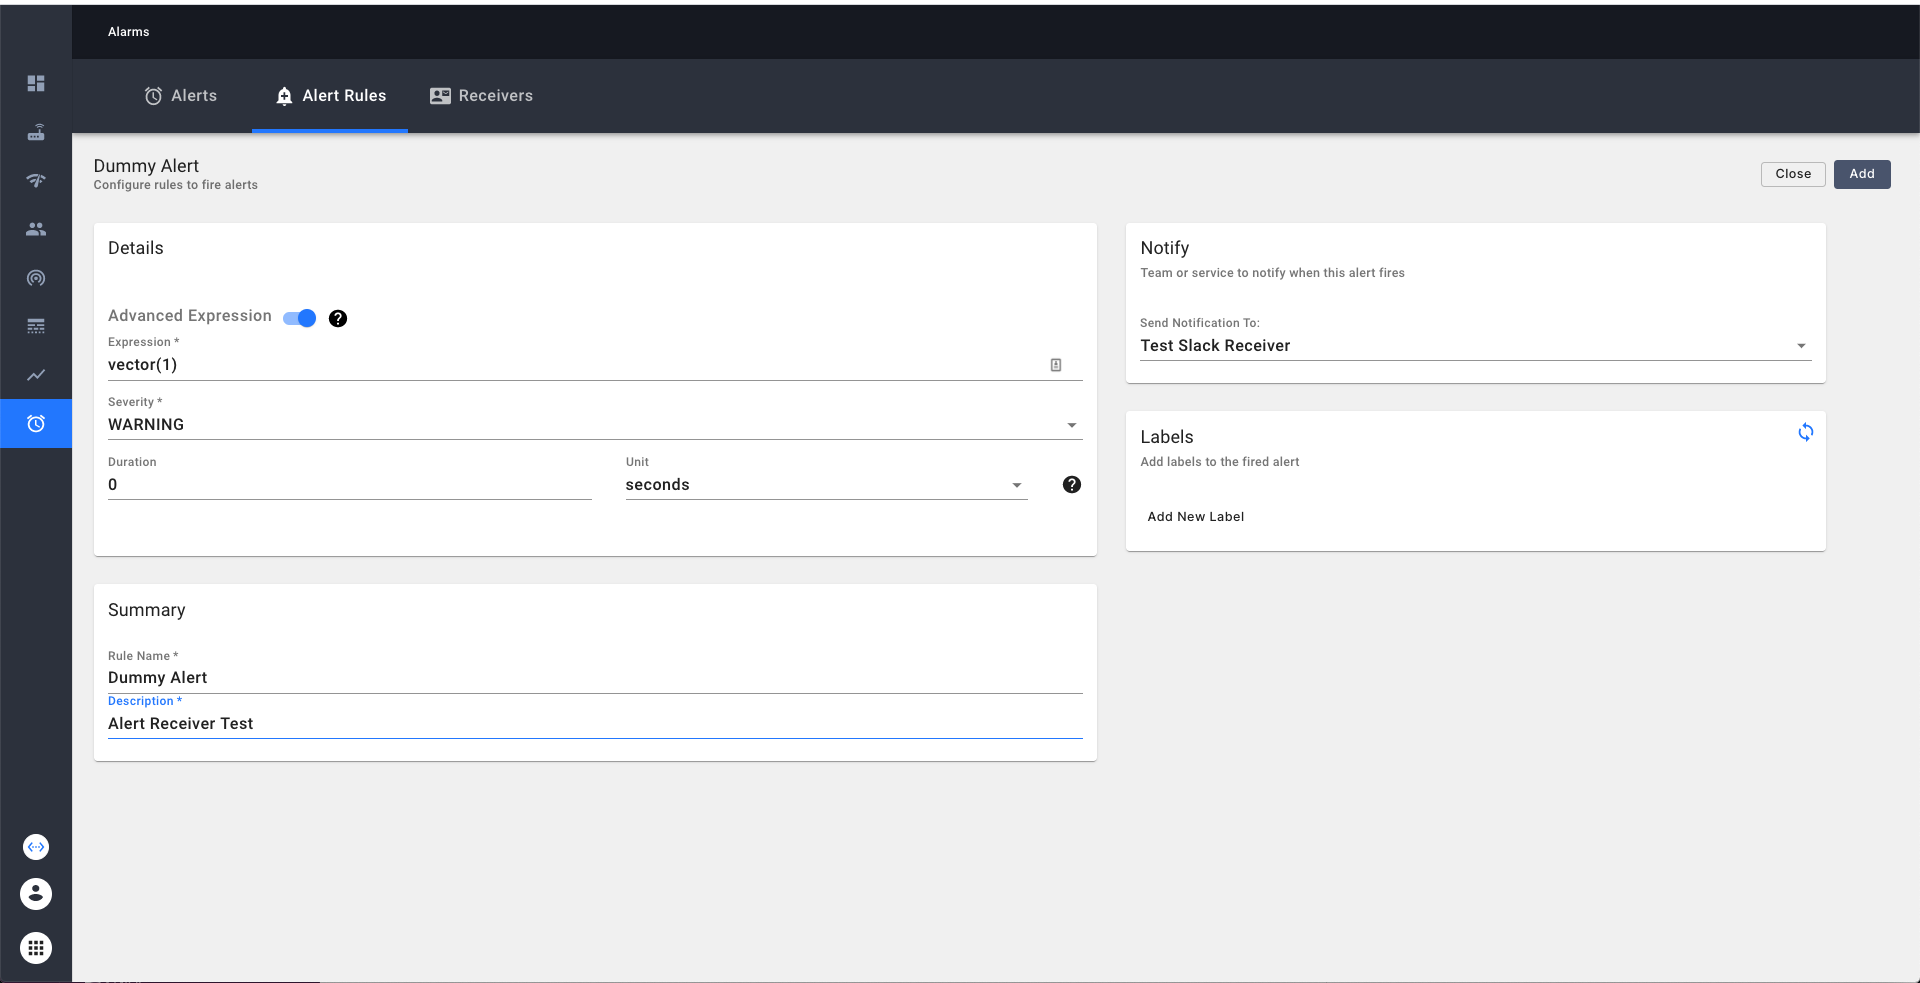
Look for the notification on the slack channel
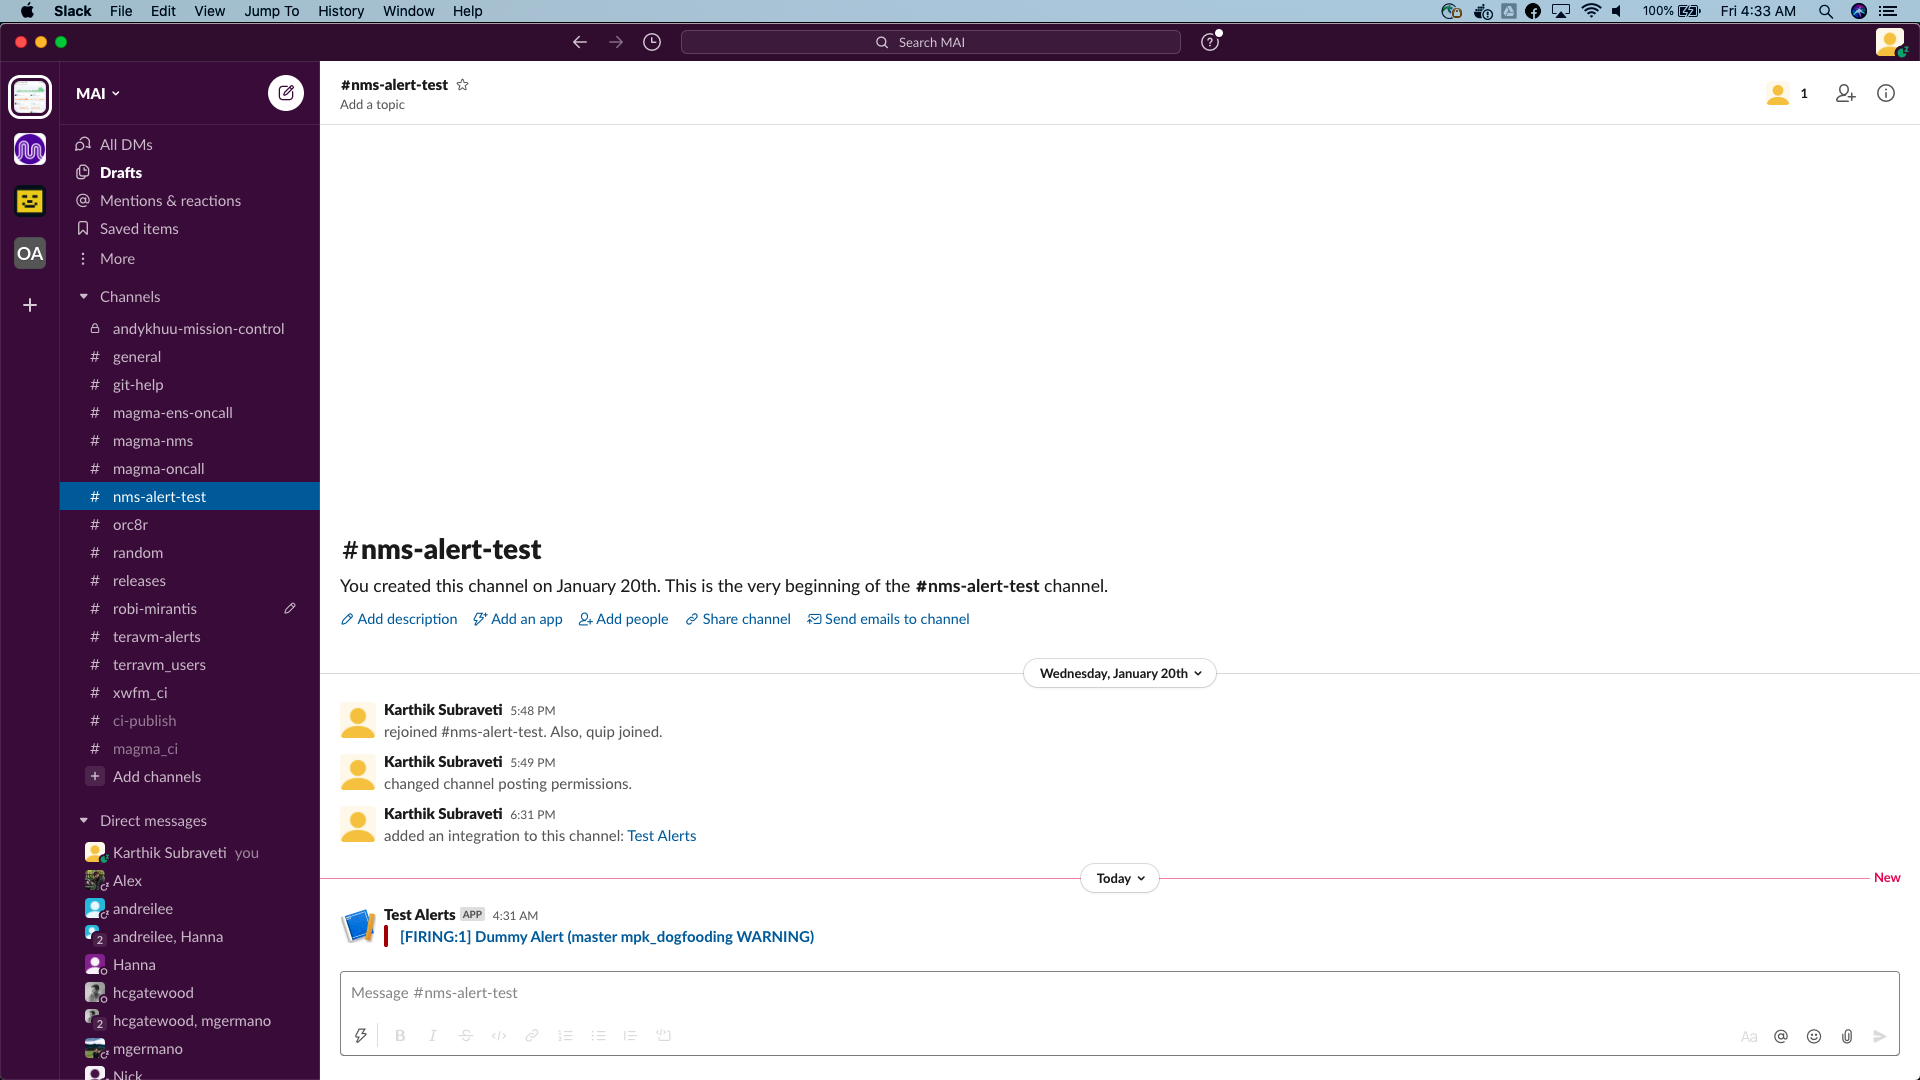
Configuring Alert rules
Alert rule configuration lets us define rules for triggering alerts.
Predefined Alerts
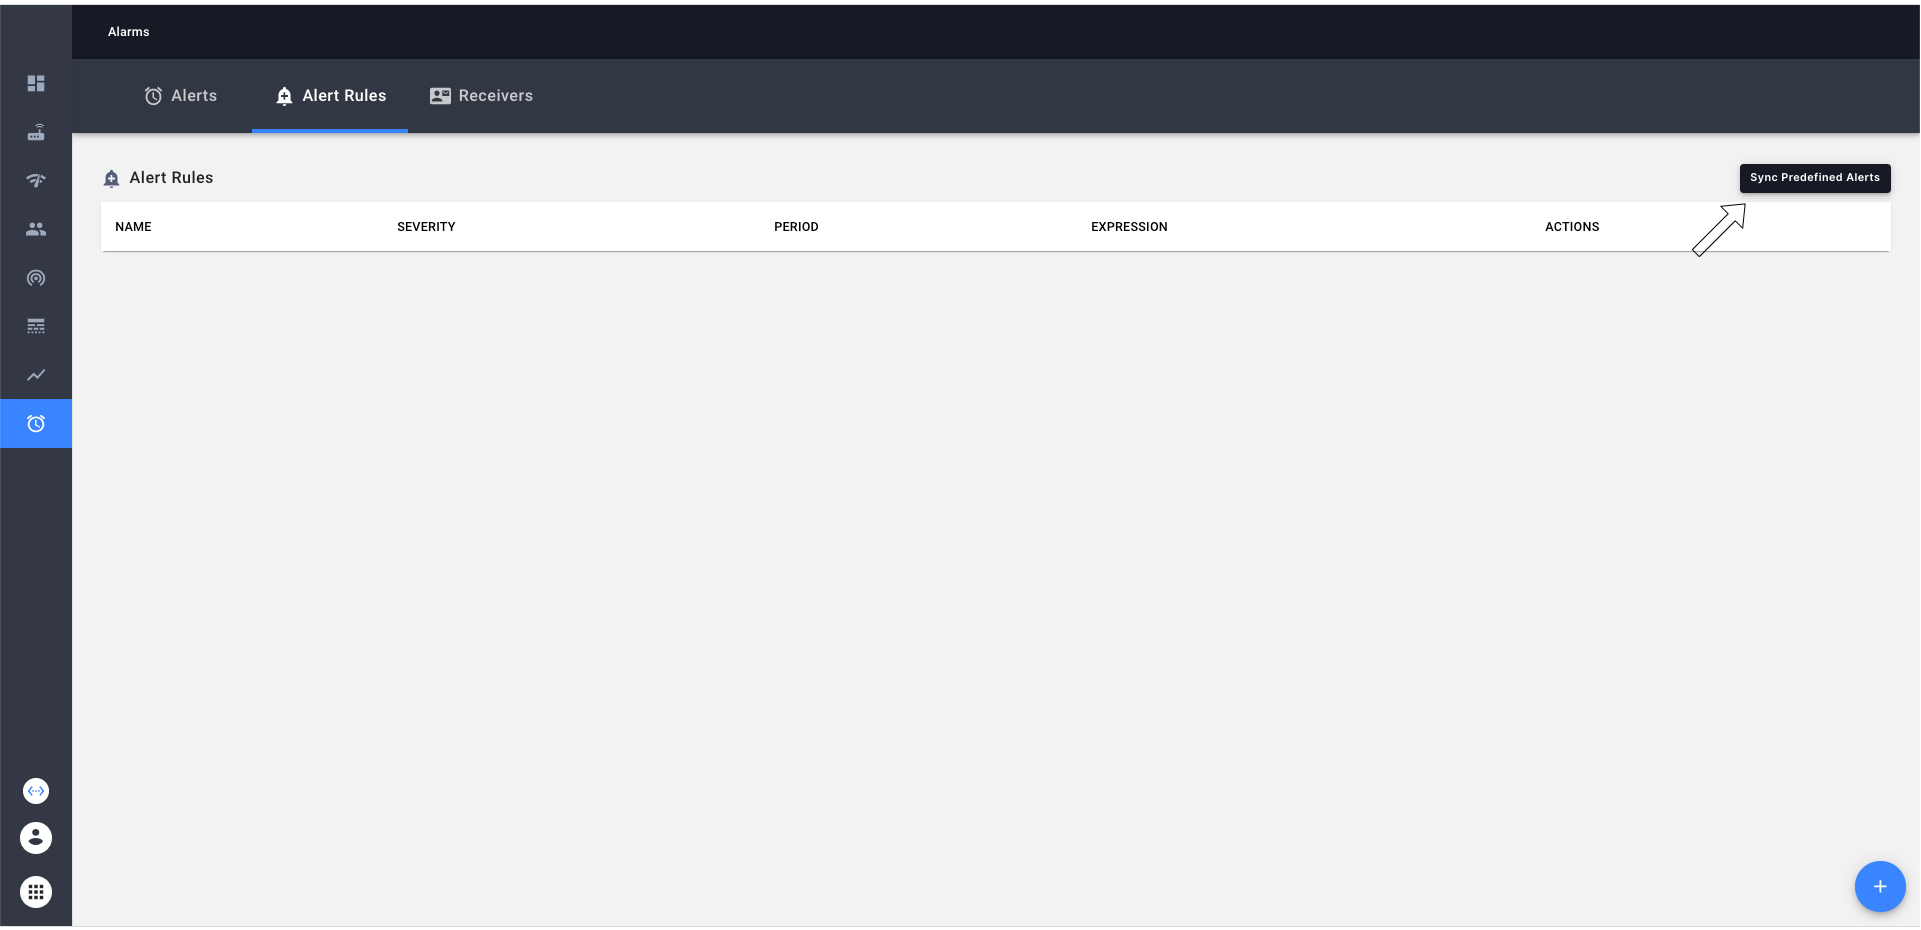
Magma NMS comes loaded with some default set of alert rules. These default rules aren’t configured automatically. If an operator chooses to use these default rules, they can do it by clicking “Sync Predefined Alerts” button in Alert rule configuration tab. As shown below
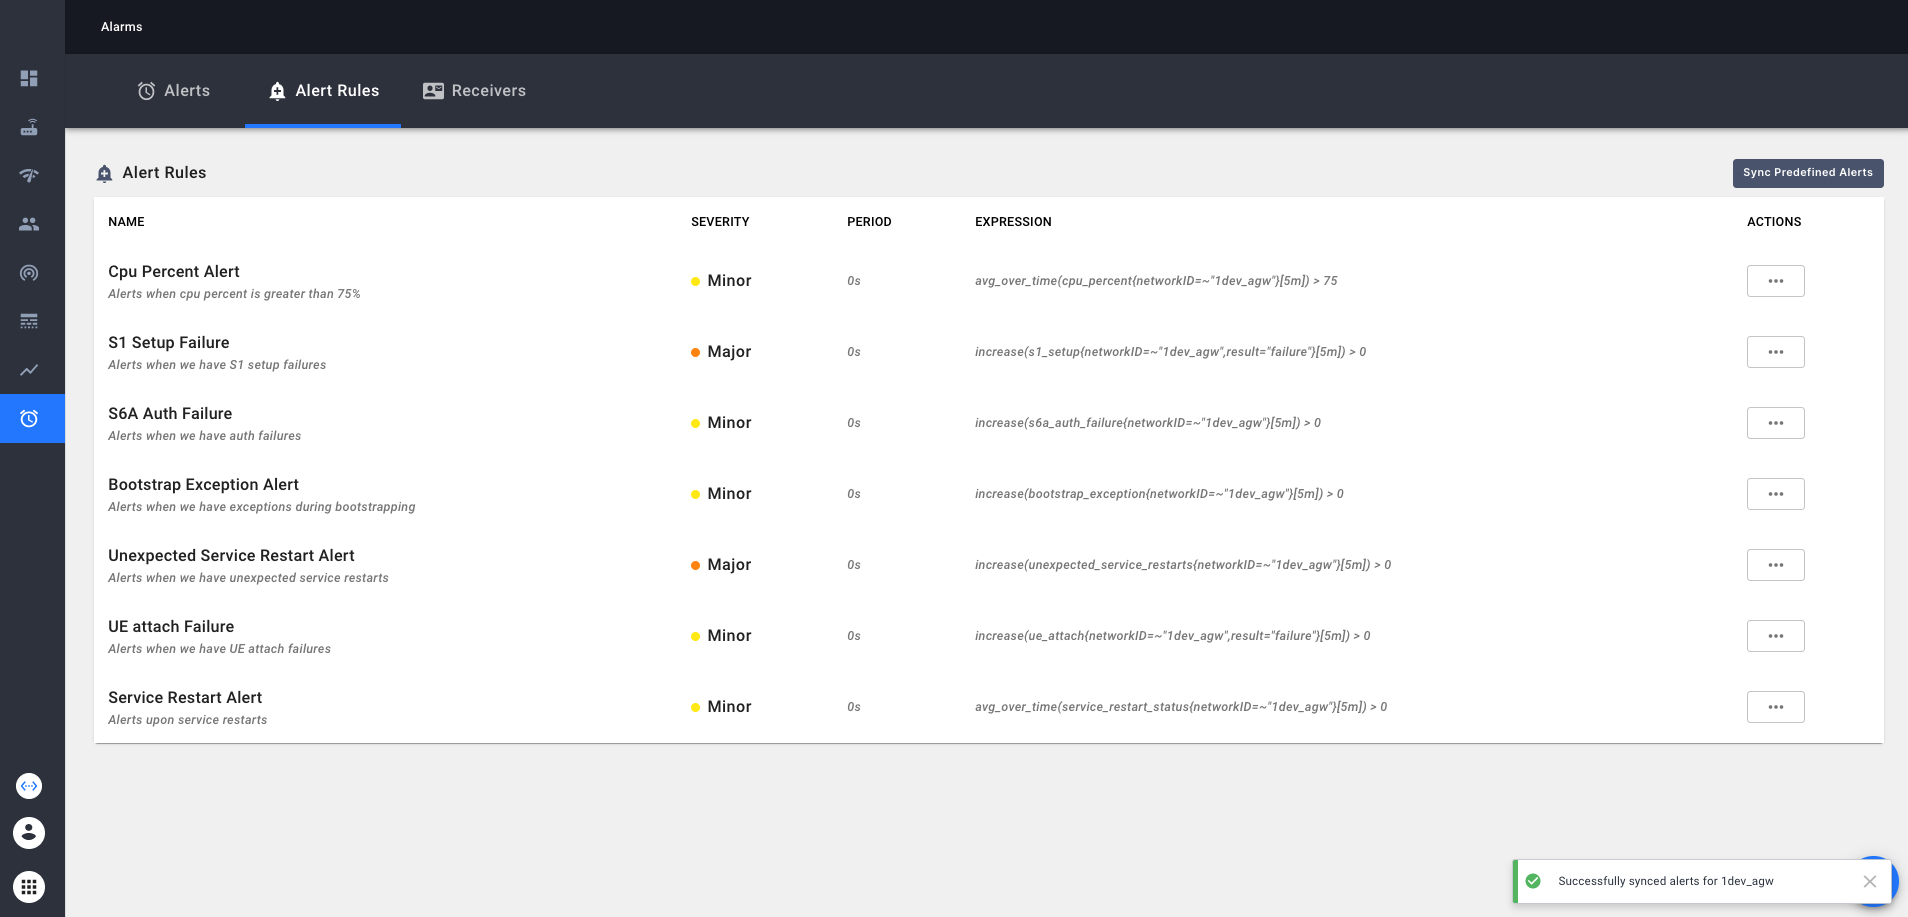
Currently predefined alerts configure following alerts
- CPU percent on the gateway is running > 75% in last 5 minutes
- Unsuccessful S1 setup in last 5 minutes
- S6A authorization failures in last 5 minutes
- Upon exceptions when bootstrapping a gateway in last 5 minutes
- When services were restarted unexpectedly in last 5 minutes
- When a UE attach resulted in a failure in last 5 minutes
- When there were any service restarts in last 5 minutes
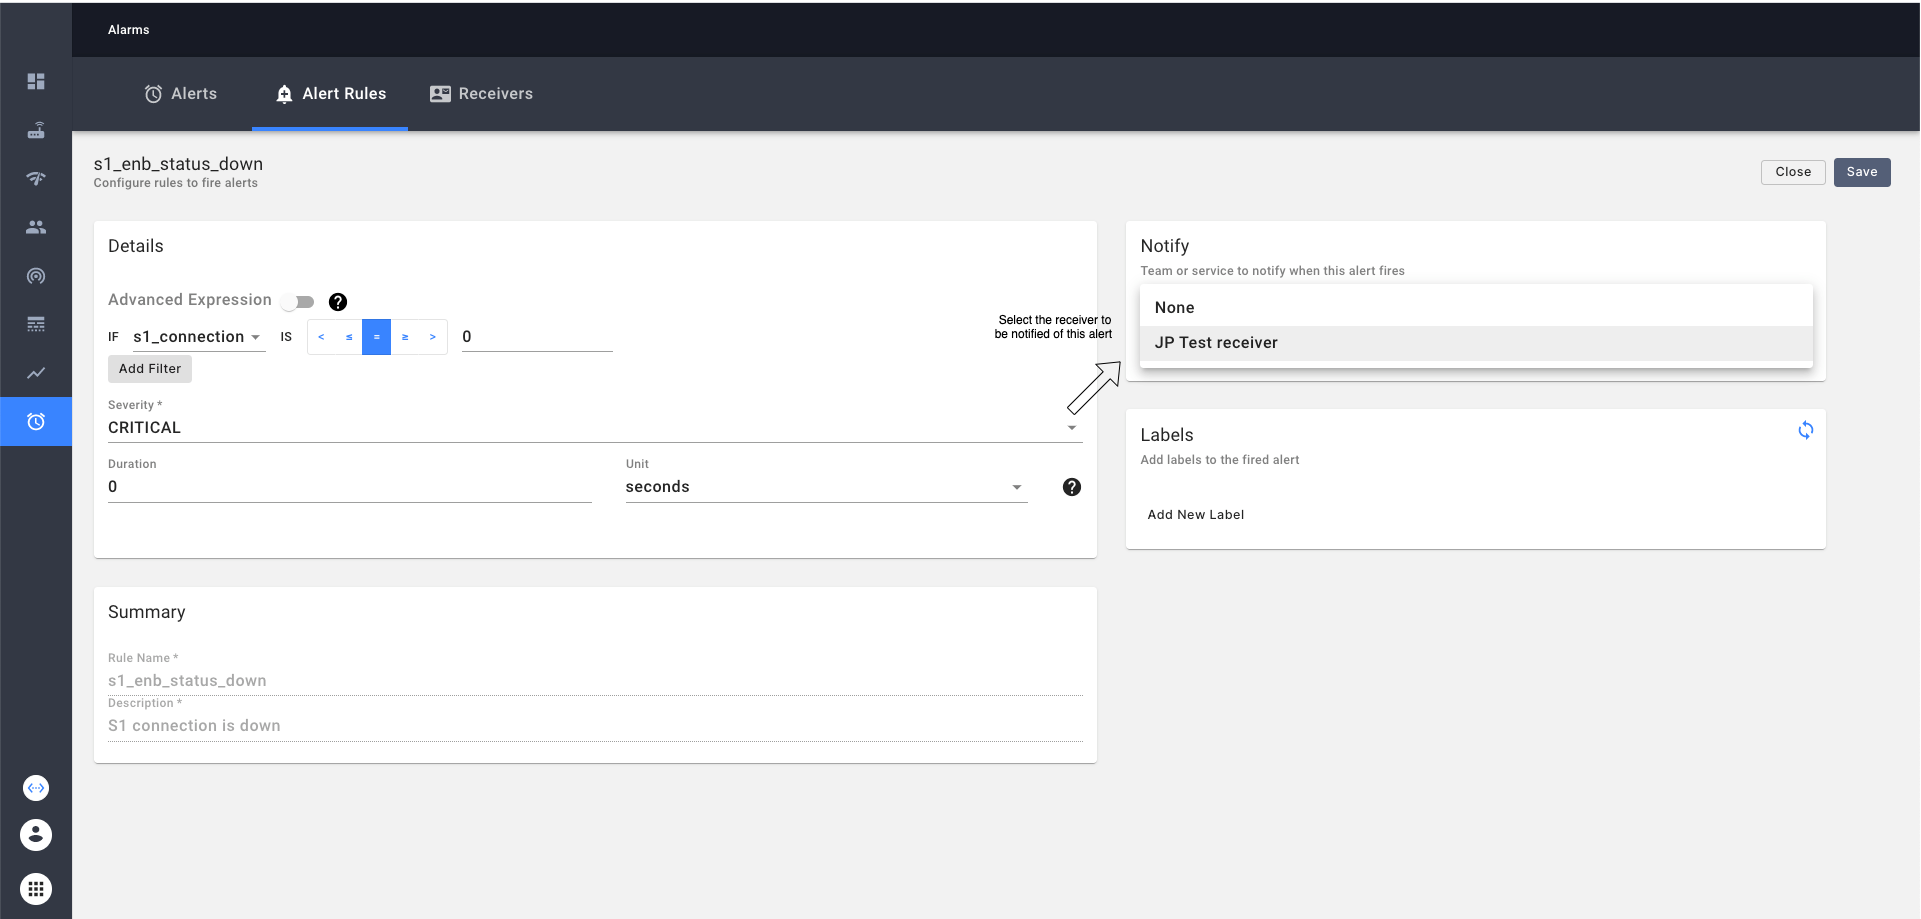
Note Operator will have to go and additionally specify the receiver in each of these alerts when they want to be notified of the alerts as follows
Custom Alert Rules
Operators can create custom alert rules by creating an expression based on metrics.
Metrics Overview
Magma gateways collect various metrics at a regular intervals and push them into Orchestrator. Orchestrator stores these metrics in a Prometheus instance. The Prometheus instance along with AlertManager provides us support in querying various metrics on the system and setting alerts based on that.
We currently support following metrics on our Access gateways.
Custom Alert Configuration
An alert configuration consists of
- Name/Description of the alert
- Alert Definition
- Alert receiver to be notified when the alert is fired (optional)
- Additional labels which can be added to provide more information about the alert. (optional)
Alert definition consists of a metric expression (a Prometheus PromQL expression) and a duration attribute which specifies the time for the expression to be true, following which the alert is fired.
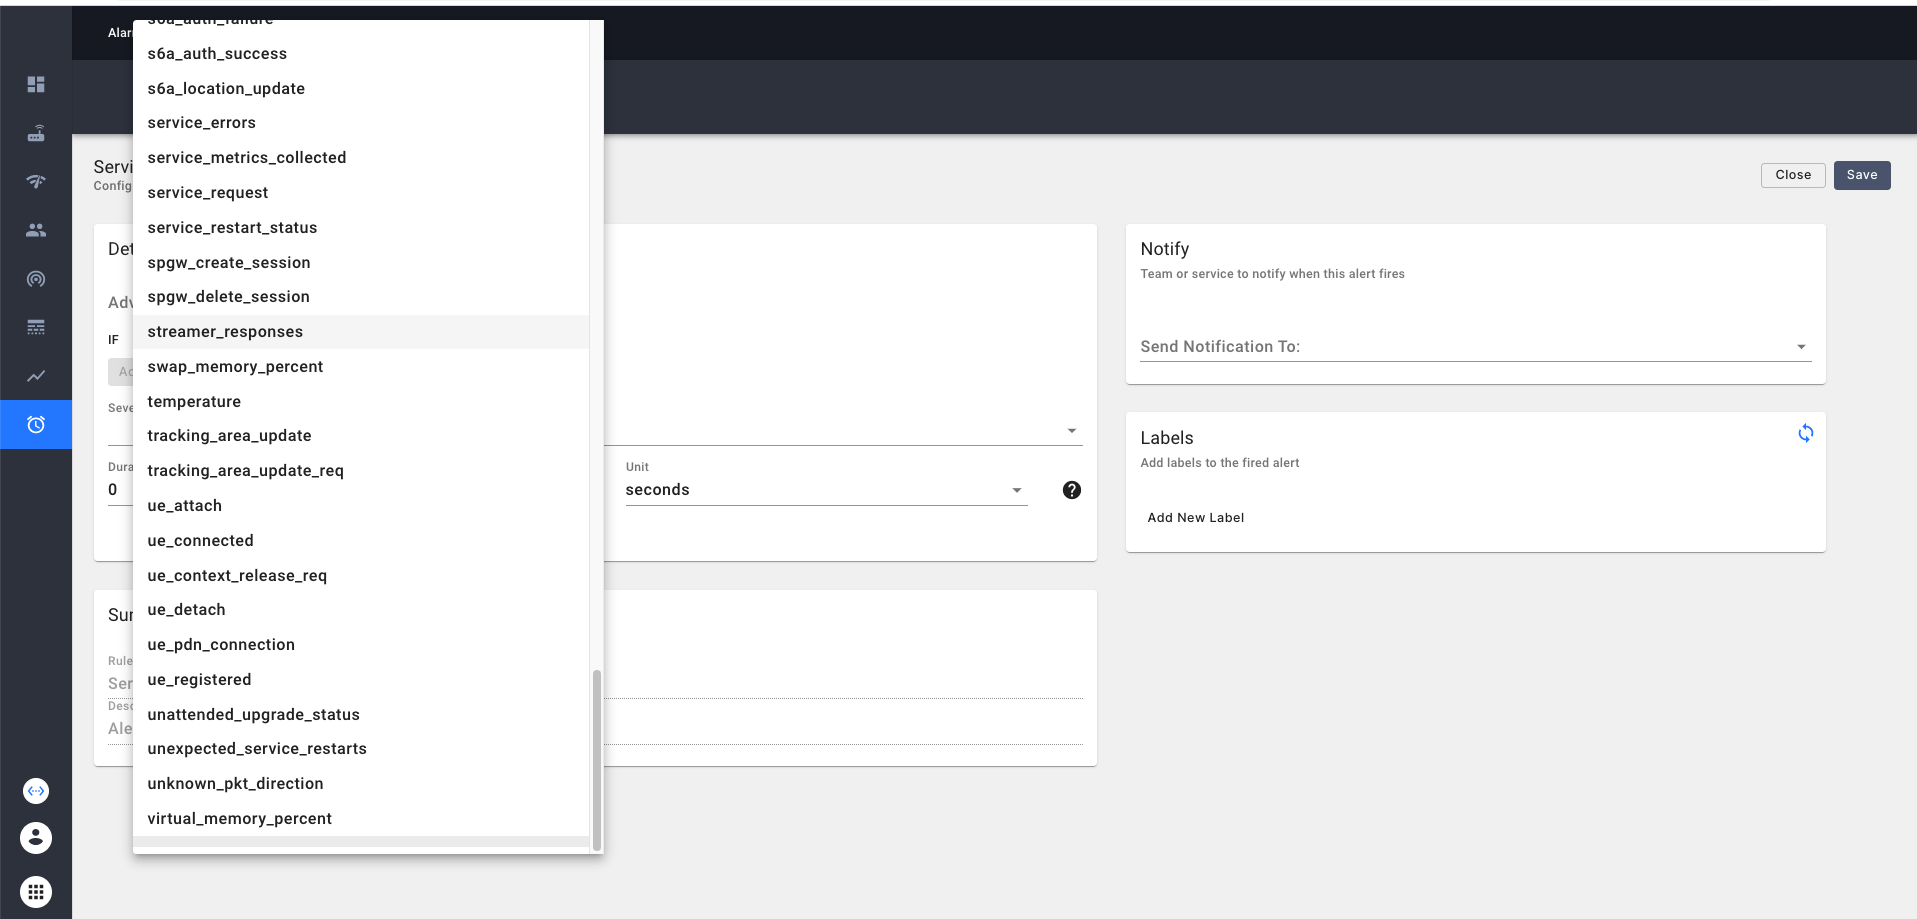
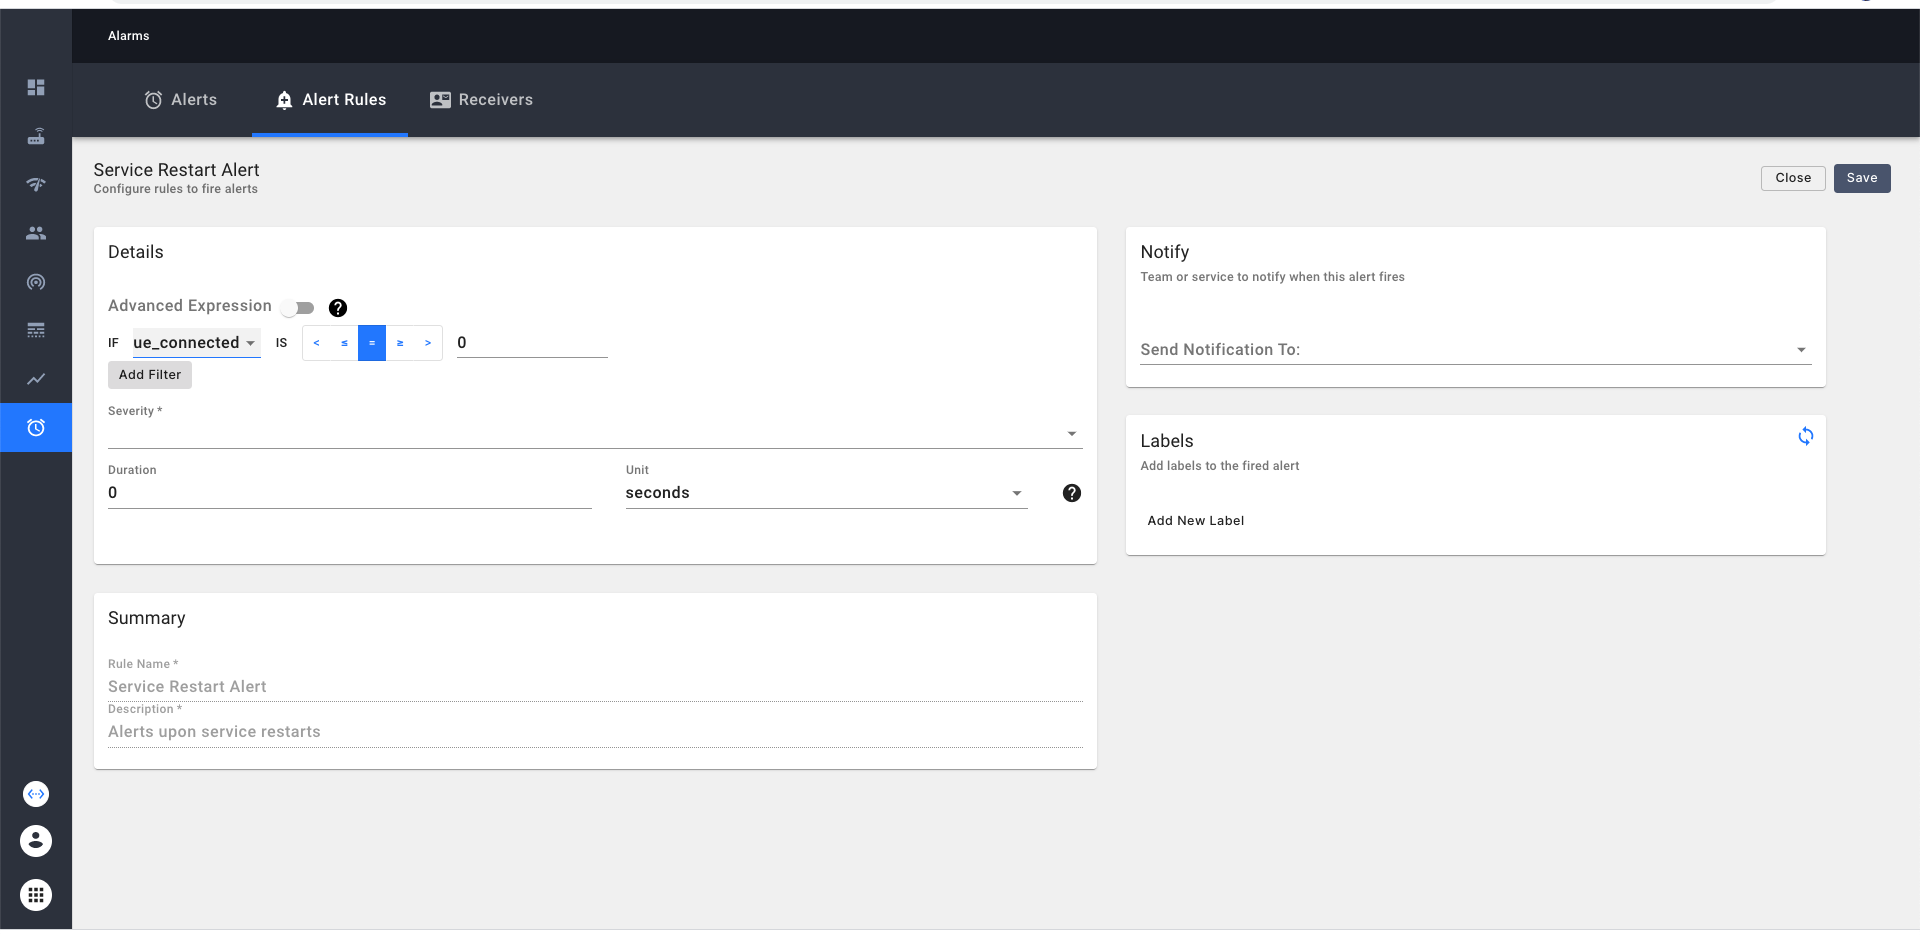
We can create a custom alert either from a simple expression or an advanced expression.
In case of a simple expression, we can choose a metric from the dropdown and construct an expression based on that
as shown below
For e.g.
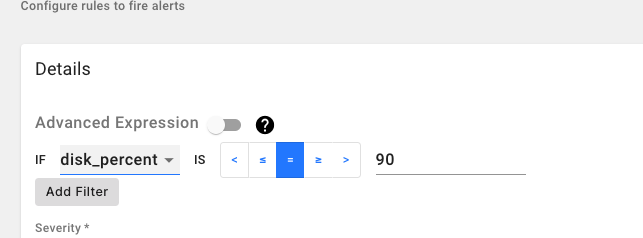
In case of an advanced expression(PromQL cheatsheet) which might involve applying different functions on metric, we can
type the advanced promQL expression directly in the textbox
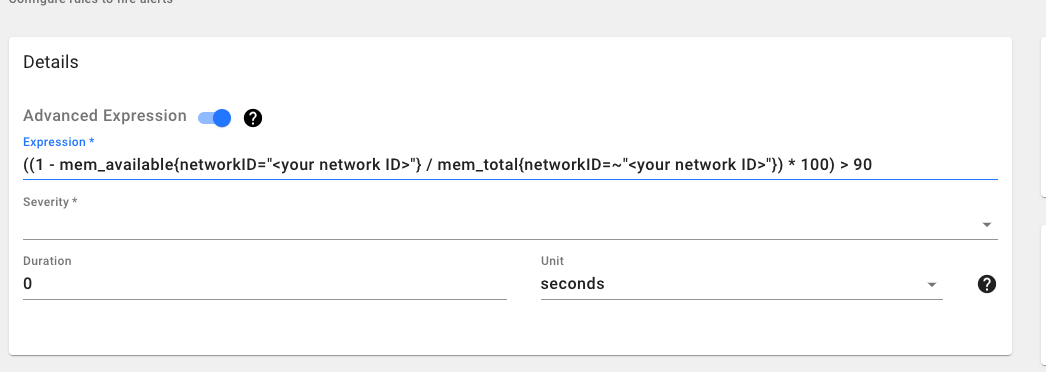
The following examples show how we can create custom alerts on the above mentioned metrics.
eNB Down Alert
This alert will fire if eNB Rf Tx is down in any of the gateways in your network.
Expression:
sum by(gatewayID) (enodeb_rf_tx_enabled{networkID="<your network ID>"} < 1)
Duration: 10 minutes
No Connected eNB Alert
This alert will fire if the connected eNB count falls to ‘0’ for any of the gateways in your network.
Simple: Select “enb_connected” metric from the dropdown and construct the if statement as “if enb_connected < 1”
Advanced Expression:
enb_connected{networkID="<your network ID>"} < 1
Duration: 5 minutes
Free Memory is < 10 Alert
This alert will fire if the free memory of any of the gateways in your network is less than 10%
Advanced Expression:
((1 - avg_over_time(mem_available{networkID="mpk_dogfooding"}[5m]) / avg_over_time(mem_total{networkID="mpk_dogfooding"}[5m])) * 100) > 90
Duration: 15 minutes
High Disk Usage Alert
This alert will fire if the disk usage of any of the gateways in your network is more than 80% Simple Way: Select “disk_percent” metric from the dropdown and construct the if statement as “if disk_percent > 80”** Advanced Expression:
(disk_percent{networkID="<your network ID>"}) > 80
Duration: 15 minutes
Attach Success Rate Alert
This alert will fire if the attach success rate of any of the gateways in your network is less than 50% for a 3h window. Expression:
(sum by(gatewayID) (increase(ue_attach{action="attach_accept_sent",networkID="<your network ID>"}[3h]))) * 100 / (sum by(gatewayID) (increase(ue_attach{action=~"attach_accept_sent|attach_reject_sent|attach_abort",networkID="<your network ID>"}[3h]))) < 50
Duration: 15 minutes
Brief Explanation: ue_attach metric is tagged with action, networkID labels. Action labels can contain be either "attach_accept_sent", "attach_reject_sent", "attach_abort". Here we are computing the percentage of the increase in ue_attach counter for a successful attach against all ue_attach actions including rejected and aborted actions and triggering an alert if the success rate for the ue_attach action is less than 50%.
Dip in User Plane Throughput Alert
This alert will fire if for any of the gateway in your network, the User Plane throughput dips by over 70% when compared day-over-day.
Expression:
(sum by(gatewayID) (((rate(pdcp_user_plane_bytes_dl{networkID="<your network ID>"}[1h])) - (rate(pdcp_user_plane_bytes_dl{networkID="<your network ID>"}[1h] offset 1d))) / (rate(pdcp_user_plane_bytes_dl{networkID="<your network ID>"}[1h] offset 1d))) < -0.7)
Duration: 15 minutes
Dip in Connected UEs Alert: This alert will fire if for any of the gateway in your network, connected UEs dip by over 50% when compared day-over-day.
Expression:
(ue_connected{networkID="<your network ID>"} - ue_connected{networkID="<your network ID>"} offset 1d) / (ue_connected{networkID="<your network ID>"}) < -0.5
Duration: 15 minutes
REST API for alerts
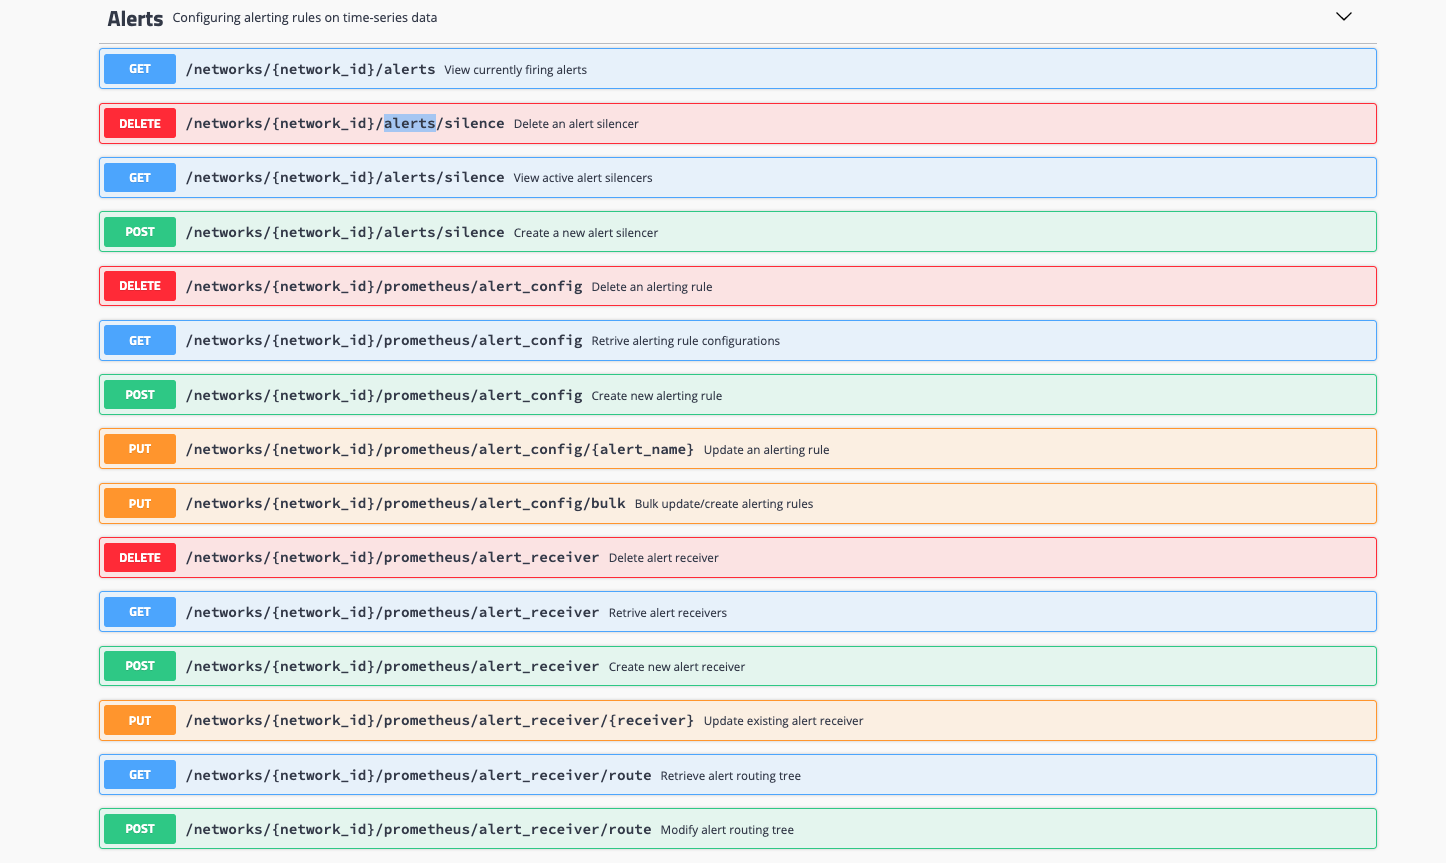
Troubleshooting
In case we are having issues with alerts. Logs from the following services will give more information on debugging this further.
kubectl --namespace orc8r logs -l [app.kubernetes.io/component=alertmanager](http://app.kubernetes.io/component=alertmanager)
kubectl --namespace orc8r logs -l [app.kubernetes.io/component=alertmanager-configurer](http://app.kubernetes.io/component=alertmanager-configurer)
kubectl --namespace orc8r logs -l app.kubernetes.io/component=prometheus-configurer -c prometheus-configurer
kubectl --namespace orc8r logs -l app.kubernetes.io/component=prometheus -c prometheus
kubectl --namespace orc8r logs -l app.kubernetes.io/component=metricsd
